Document Type : Original Article
Authors
Department of Chemistry, College of Science, University of Baghdad, Baghdad, Iraq
Abstract
The detection of metronidazole (MTZ) in pure and pharmaceutical formulations is now possible with a newly developed analytical technique based on turbidimetric measurement (from 0 to 180 degrees) utilizing a NAG-4SX3-3D analyzer. The technique relied on the fact that phosphotungstic acid and metronidazole would precipitate white in an acidic medium, indicating the presence of an ion pair molecule. In order to measure turbidity, we used the attenuation of light after it collided with precipitated particles on surfaces with angles ranging from 0 to 180 degrees. We looked into both chemical and physical parameters. With a linear dynamic from 0.05 to 20 mmol.L-1, metronidazole has a correlation coefficient value ® of 0.9993. From the step-wise dilution for the least concentration in the linear dynamic range of the calibration graph with an RSD percent lower than 0.5 percent, we find that the detection limit for 3, 35 mmol.L-1 (n = 8) metronidazole is 29.953 ng/sample. Four medicinal items have been successfully identified using this method. Standard addition and a t-test were used to compare the newly developed method of analysis to the tried-and-true methods (the HANNA equipment for turbidity measurement and the UV-spectrophotometric method). The researchers found no significant difference between the three methods at the 95% confidence level.
Graphical Abstract
)
Keywords
- Metronidazole Phosphotungstic acid Continuous flow injection analysis turbidity NAG
- 4SX3
- 3D analyzer
Main Subjects
Introduction
Metronidazole (MTZ), also known as 1-(hydroxyethyl)-2-methyl-5-nitroimidazole (Scheme 1), is a nitroimidazole derivative that was initially used as a systemic antitrichomonal drug in 1960 [1].
Metronidazole is one of the primary medications for treating infections [2] caused by anaerobic bacteria, protozoa, and microaerophilic bacteria. Microorganisms that can tolerate anaerobic conditions are cytotoxic. It treats various conditions, including gastrointestinal amebiasis, liver amebiasis [3, 4], bacterial septicemia; bone and joint infections; meningitis; brain abscess; endocarditis; endometritis; bacterial vaginitis; and surgical prophylaxis for colorectal procedures. The action mechanism is based on nitro group partial reduction. Some biological effects can be attributed to partially decreased metabolites due to their ability to attach to macromolecules in bacteria and cells. Bacterial DNA reacts with reactive metabolites to stifle DNA and protein synthesis, eventually leading to cell death. DNA is known to interact with biological macromolecules in both humans and animals. Human DNA single-strand breaks were detected after a single therapeutic dose of metronidazole. In vitro, human lymphocyte cultures confirmed the same findings. High-performance liquid chromatography (HPLC)-spectrometry [5, 6], gas chromatography/mass spectrometry (GC/MS) [7, 8], capillary electrophoresis [9], and thin-layer chromatography (TLC) [10] are just some of the technologies that have been used to detect metronidazole.
The advantages of CFIA-Turbidity are its inexpensive price, fast response time, excellent sensitivity, and potential for downsizing. Scheme 2 shows the thought-out mechanism: metronidazole interacts with phosphotungstic acid as a precipitating agent in an acidic solution to form a white precipitate [11].

Scheme 1: Chemical structure of metronidazole

Scheme 2: The proposed mechanism of reaction metronidazole with phosphotungstic acid
Material and Methods
The chemicals used to make the solutions were of analytical reagent quality, and all of the water used was distilled. Dissolving 0.58875 g of metronidazole (molecular weight 171.15 g.mol-1, BDH) in 100 mL of distilled water yielded a 0.05 M metronidazole standard solution (C6H9N3O3). To create a 0.012 M standard solution, 250 mL of distilled water was combined with 8.6406 grams of phosphotungstic acid (H3PW12O40) with a molecular weight of 2880.2 g.mol-1 (Hopkin and Williams LTD).
Instruments
A flow cell derived from a home-built NAG-4SX3-3D analyzer was utilized [12-14]. The output of incoming light's 0-180 °attenuation was recorded (Figure 1). A potentiometric recorder (Siemens, Germany) captured the signal outputs. With a sample loop and a six-port injection valve, an Ismatic peristaltic pump (Teflon, variable length). For the conventional procedures, turbidimetry and UV spectrophotometric (Shimadzu, Japan) equipment were utilized.

Figure 1: Diagram of the manifold used to measure metronidazole, which is determined by the white precipitate that is produced when metronidazole reacts with phosphotungstic acid
Optimization of reaction parameters
Chemical parameters
Chemical parameters such as medium type, medium acid concentration, and phosphotungstic acid concentration as precipitating agents were investigated to optimize optimal settings for maximum response and sensitivity. It was discovered that 7 mmol/L of phosphotungstic acid was the best concentration, as shown in Figure 2. A, sulfuric acid was selected as the reaction medium, as shown in figure 4. B, and the concentration of sulfuric acid was 70 mmol.L-1. This concentration of sulfuric acid was found to be the best concentration of sulfuric acid as a carrier stream for the (metronidazole-phosphotungstic acid) system because it gave the highest response and will be used in subsequent studies, as shown in Figure 2c.
Physical parameters
Physical parameters such as flow rate, length of reaction coil, injected volume, and Y-junction were studied for their impacts on the response of metronidazole to phosphotungstic acid. It was discovered that the best conditions were: a flow rate of 2.5 ml.min-1, a sample volume of 175 µl, 314 µl of reaction coil, and a choice of 21.2 µl to obtain the best response with high sensitivity and selectivity with low material consumption. The results are represented in Figure 3a, b, c, and d.
Changes in light attenuation energy transducer output as a function of metronidazole concentration
The calibration graph also referred to as a standard curve in analytical chemistry, is a general procedure used to determine the chemical substance concentration in an unknown sample by creating sets of known concentrations and contrasting them with the unknown. The calibration curve was created for the proposed method by applying all of the best chemical and physical parameters that were selected. Following that, a series of metronidazole solutions (0.05–35 mmol. L-1) were made.
.jpg)
Figure 2: a) Effect of reagent concentrations on the response profile, b) Effect of medium type (acids and salts) on response profile "YZi- t (min)" (dmm), c) Attenuation of energy transducer response for the detection of metronidazole by the precipitate formation
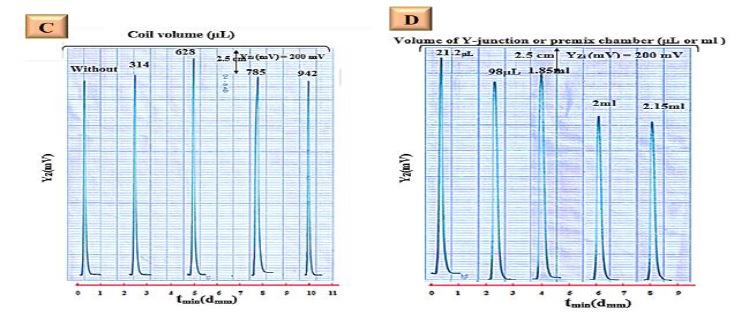
Figure 3: a) Effect of flow rate on the response profile, b) Effect of sample volume on response profile "YZi- t (min)" (dmm), c) Influence of reaction coil volume on the response profile, d) Light attenuation caused by Y-junction influence
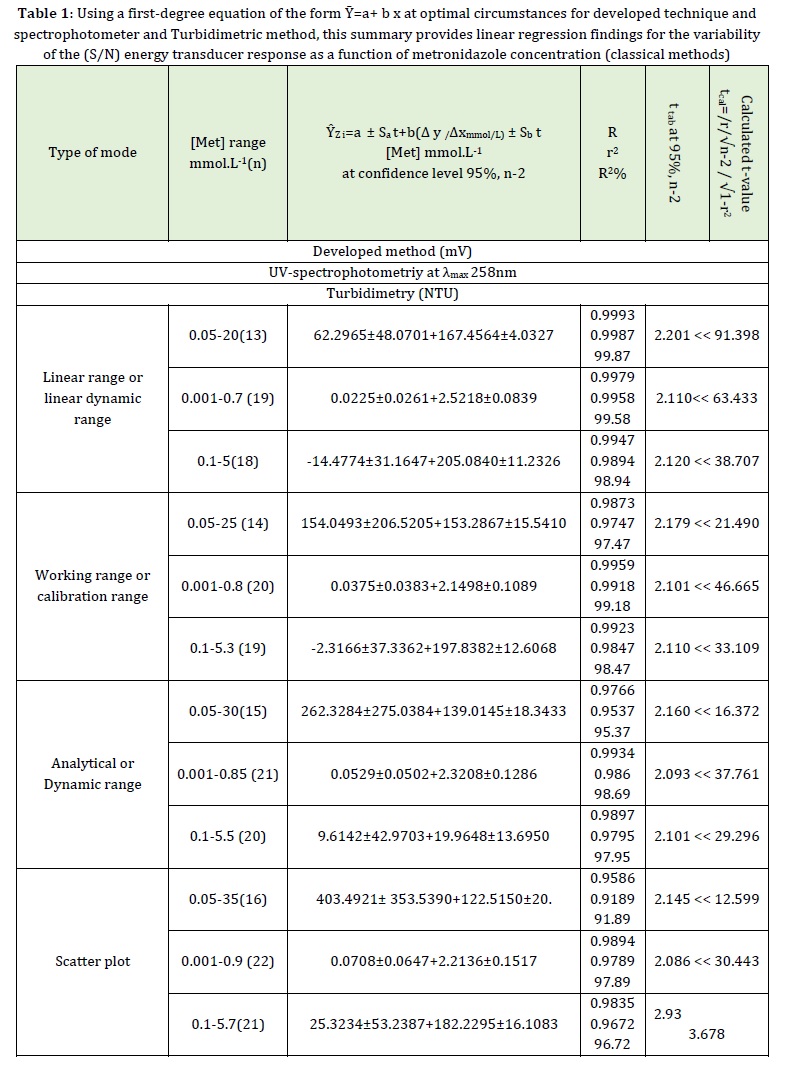
The NAG-4SX3-3D analyzer's energy transducer response changed linearly from 0.05 to 20 mmol. L-1 in response to metronidazole concentration, with a correlation of Ȳzi (Mv) versus tmin (dmm) of 0.9993 and a coefficient of determination of 0.9987. This linear response account for 99.87% of the results.
The evaluation of a newly created approach (i.e., the NAG-4SX3-3D analyzer) for the detection of metronidazole was compared with two methods described in the literature: the UV-spectrophotometric method at λmax = 258 nm (Figure 4) and the turbidimetric method as shown in Table 1.
Detection limit
Metronidazole's detection level was investigated from three aspects: practically, through increasing dilution; theoretically, through a slope value and experimentally, using a standard curve. The detection limit for the metronidazole-phosphotungstate-hydrogen sulfide (PTA-H2SO4) system is calculated in Table 2.

Figure 4: Absorbance of UV- Spectrum of metronidazole at a concentration of 0. 4mmol.L-1 that shows λmax = 258 nm
Repeatability
The repeatability of a proposed or new method is measured by comparing the results from different preparations of the same analyte. The same operator, instrument, laboratory, and materials are used for this measurement; the only variable is the number of measurements for the same analyte concentration. Therefore, eight injections were evaluated at a constant metronidazole concentration. Two distinct intensities were present (3 and 35 mmol.L-1). The relative standard deviation was less than 5%, as shown in Figure 5 and Table 3.
Table 2: Detection Limit of Metronidazole -PTA - H2SO4 system Using 175 µL injection Sample and Optimal parameters


Figure 5: A profile of eight successive measurements with repeatability of profile for 3 mmol

Determination of metronidazole in drugs using NAG-4SX3-SD analyzer
The devised approach was applied to four samples of medication from four different manufacturers (Flazol, Tabuk, Saudi Arabia, 500 mg); (Metrosule, Ajanta, India, 500 mg); (Negazole, Julphar, U.A.E., 500 mg); and (Metronidazole, Ajanta, India, 500 mg) (Flagyl, Sanofi, Spain, 500 mg). Using UV-spectrophotometric by measuring absorbance at λmax = 258nm [15] and the turbidimetric method, the attenuation of incident light at 0-180° for a white precipitate of metronidazole that reacted with phosphotungstic acid in an acidic medium was studied.
Using a newly developed technology (the NAG-4SX3-3D analyzer) and two other techniques (UV-spectrophotometric absorbance measurement at max = 258 nm and turbidimetric measurement), the data was mathematically processed and displayed in Table 4. (a). See Table 4 instead of (t-test) (Figure 6) [16], which compares two possible outcomes. At a 95% level of confidence and with high efficiency, B supplies the active component's usable content. Table 4. B shows the results of comparing the NAG-4SX3-3D analyzer's calculated t-values with the official stated value (500 mg) for each company.
One way to estimate a hypothesis is to start with the null hypothesis, which states that there is no statistically significant difference between the sample averages.
(Ẁi and quoted value µ i.e., Ho: Ẁi= (500 mg) for (Flazol, Tabuk, Saudi Arabia, 500 mg)), (Metrosule, Ajanta, India, 500 mg), (Negazole, Julphar, U.A.E., 500 mg), and (Flagyl, Sanofi, Spain, 500 mg).
A large discrepancy exists between the means and the stated number in favor of the null hypothesis (500 mg).
There is a statistically significant discrepancy between the stated and measured amounts of the active ingredient since t cal > ttab (4.303) at a confidence level of 95% and a degree of freedom of = 2. This means the null hypothesis was rejected, and the alternative hypothesis was accepted.
The new method performs conventional addition techniques when applied to this foundation.
Since the computed t-value is smaller than the tabulated t-value, this further indicates no statistically significant discrepancies between the established method and the method claimed by the corporation.
As a result (Figure 7), the newly developed method can be utilized as a replacement method for detecting metronidazole in pharmaceuticals.
Second, a paired t-test with a significance level of = 0.05 (2-tailed) was used to compare the newly developed methodology with the NAG-4SX3-3D analyzer to two traditional methods: UV-spectrophotometry with a Shimadzu (double beam UV-1800) spectrophotometer and turbidity with a turbidity meter (HANNA, Hungry). Table 4 displays the results of a measurement of the attenuation of incident light from 0 to 180 degrees. Assumption B: All medications from all manufacturers are for the same population, i.e., no individual differences exist between the manufacturers.
The average of the two approaches shows no discernible difference.
Another possibility is that the mean results from the conventional approach and the NAG-4SX3-3D analyzer differ significantly.
An Optional Hypothesis H1: The NAG-4SX3-3D Analyzer as the Standard Reference Method for Measuring Turbidity.
Results obtained reveal no significant difference (at the 95% = 0.05 level of confidence) between the devised approach, the UV-spectrophotometric method, and the turbidity method (traditional methods) (Scheme 2 and Table 4 (b)).
Table 4 (a): The NAG-4SX3-3D metronidazole-phosphotungstic acid system analyzer was used to determine the concentration of metronidazole in four medication samples. The results were compared to those obtained using two traditional methods

Table 4 (b): An overview of the metronidazole-phosphotungstic acid system's practical application, efficiency (Rec%) in determining Metronidazole in four medication samples, and individual t-test in comparing mean weight to quoted value


Figure 6: Profile - time for standardized Met-PTA system addition procedure involving four companies standardized Met-PTA system addition procedure involving four companies

Figure 7: Set of results for comparing actual content to claimed content by (Individual t-test) and Paired t-test
Figure 8, four-by-four ANOVA [17, 18], describes the treatment of the data obtained for analyzing four drugs with the same active ingredient content manufactured by different supplier companies. The columns represent the drug sample supplied by different suppliers, while the rows represent methods. While table 5 tests the effect between subjects (i.e., Supplier Company) and shows the interaction of methods and different samples by ANOVA table that shows the sum of squares, degree of freedoms, means squares, and F- value. The assumption is made to accept H° (Null hypothesis).
(H°: µFlazol – Saudia Arabia = µmetrosul – India = µNegazole – UAE = µ Flagyl – Spain). If the significant level is greater than 0.05 at a 95% confidence level (i.e., Fcal ˂ Ftab.) there is no difference between all used mean of each sample from different companies concerning the output of results. The alternative proposed is that there is a significant difference between all means of values (i.e., H1 (alternative hypothesis))
H1: µFlazol – Saudia Arabia ≠ µmetrosul – India ≠ µNegazole – UAE ≠ µ Flagyl – Spain
The obtained results that were summarized in Table 5 show that there is no significant difference between the means of samples, the value of FCal (1.127981) << F tab (3.490295).
Therefore Null hypothesis will be accepted and will reject the alternative hypothesis. These mean this means there are no significant differences between the four companies for used samples (four samples).

Figure 8: Results obtained via utilizing ANOVA

Conclusion
The conclusion indicates that the four used data of different drugs using continuous flow injection analysis method with NAG-4SX3-3D Analyzer can be used as the reference method that gave a satisfactory result when it was compared with the standard reference method.
Acknowledgements
We would like to extend our sincere gratitude to Prof. Issam Mohammad Ali Shakir for his superb direction and assistance in finishing this research as well as for providing us with the essential items.
Funding
This research did not receive any specific grant from funding agencies in the public, commercial, or not-for-profit sectors.
Authors' contributions
All authors contributed to data analysis, drafting, and revising of the paper and agreed to be responsible for all the aspects of this work.
Conflict of Interest
We have no conflicts of interest to disclose.
ORCID:
Sarah F. Hameed
https://orcid.org/0000-0002-7607-3498
HOW TO CITE THIS ARTICLE
Nagham Shakir Turkie, Sarah Faris Hameed. A pioneered homemade NAG-4SX3-3D analyzer coupled with continuous flow injection analysis new approach for the on-line turbidimetric measurements of metronidazole in pure and pharmaceutical formulations. Chem. Methodol., 2023, 7(1) 53-66
https://doi.org/10.22034/CHEMM.2023.356013.1592
URL: http://www.chemmethod.com/article_158407.html
)