Document Type : Original Article
Authors
Department of Food Science and Technology, Faculty of Agriculture, Varamin-Pishva Branch, Islamic Azad University, Varamin, Iran
Abstract
Due to the disadvantages of synthetic antioxidants, natural antioxidants have attracted more attention in recent years. Plants are a rich source of phenolic and flavonoid compounds among the most important natural antioxidants. Therefore, the objective of this study was to optimize the extraction of flavonoids, total phenols, antioxidant and antimicrobial compounds from Ganoderma (G) lucidum by ultrasonic pretreatment. To do so, independent variables including type of solvent (ethyl acetate, 50% ethanol, and 50% ethyl acetate), extraction time (6, 9, and 12 min), and ultrasonic power (150, 200, and 250 W) as well as Box-Behnken response surface methodology (RSM) were used. The results showed that the simultaneously optimized conditions for obtaining the maximum flavonoid content (14.3348 mg/g) and total phenolic content (24.6648 mg/g) and the lowest IC50 (2.3987 mg/mL) with 100% desirability included ultrasonic power of 250 W, ultrasonic time of 12 min and ethanol solvent. The highest mean minimum inhibitory concentration (MTC) and minimum bactericidal concentration (MBC) of G. lucidum extract obtained by ultrasonic pretreatment were 2500 and 5000 μg/ml, respectively, against Clostridium perfringens. Optimal treatment using ultrasonic pretreatment had superior antimicrobial activity against Staphylococcus aureus with the largest diameter of non-growth halo (zone of inhibition) (14.33 mm) compared to E. coli and C. perfringens. Therefore, ultrasound is a valuable method for extracting bioactive compounds of G. lucidum. The extracted natural antioxidants can be incorporated into the food formulations to replace synthetic antioxidants.
Graphical Abstract
)
Keywords
Main Subjects
Introduction
Iran is blessed with rich and diverse medicinal plants and their habitats. Medicinal plants are rich in secondary metabolites and contain the active compound of many medicines. Although these compounds are made mostly through directing genetic processes, their products are remarkably affected by environmental factors as these factors cause changes in the growth of medicinal plants and the amount and quality of their active compounds such as alkaloids, glycosides, steroids, and volatile oils [8]. Antioxidants are compounds that scavenge free radicals, thereby preventing their oxidative attacks and protecting the cells from free radicals' destructive effects by inactivating them [32]. Antioxidants inhibit the spread of oxidation chain reactions by transferring hydrogen atoms to the generated free radicals. The efficiency of an antioxidant depends on the ease of hydrogen atom transfer from the antioxidant [12]. Phenolic compounds are the most effective antioxidants; They transfer hydrogen atoms well. Today synthetic antioxidants are commonly used in the medical, agricultural, and pharmaceutical industries. There is ample evidence that food containing synthetic antioxidants has toxic and adverse effects on the consumers thus it is highly desirable to find natural antioxidants, especially from plant sources [55].
Some of the most important natural antioxidants are alkaloids, tannins, flavonoids, and phenolic compounds [26]. There are various methods for extracting antioxidant compounds from different plants. Therefore, there is a growing demand for more efficient and effective methods for extracting active compounds from plants. Ultrasonic waves are one of the novel methods for extracting phenolic and other valuable compounds from foods at laboratory and industrial scales [27]. Ultrasonic waves destruct the cell wall within a short time. The advantages of using ultrasound in the extraction process include shorter extraction time compared with traditional extraction using the Soxhlet method, high efficiency, and simple equipment compared with extraction using supercritical fluid and microwaves, low cost, and low extraction temperature, which provides the possibility of extracting heat-sensitive compounds and using different solvents for extracting a wide range of natural plant compounds [53]. Sherafati-Chaleshati et al. (2009) extracted the active compounds from Antirrhinum majus, Hakimi et al. (2020) from Satureja avromanica Maroofi L., Khodadoost et al. (2020), from Adiantum capillus-veneris, Hossain et al. (2012) from Organum Majorona, Moghimi et al. (2018) from Carum carvi and Prommajak et al. (2014) from Houttuynia cordata by using ultrasound method.
Ganoderma (G) lucidum, an annual mushroom belonging to the Ganodermataceae family, is known as the best medicinal mushroom due to its various therapeutic properties [36]. Numerous reports have been published on the bioactive compounds of this mushroom. The fruiting body, mycelium, and spores of G. lucidum contain 400 active compounds. The most important ones are triterpenoids, polysaccharides, nucleotides, sterols, steroids, fatty acids, proteins, peptides, and many other scarce substances [16]. Total polysaccharides of G. lucidum include β-D-glucans, heteropolysaccharides, and glycoproteins. The polysaccharides with β (1→3) glucan bonds boost the immune system. These polysaccharides have antioxidant, antibacterial, antiviral, and radiation protecting properties. They stated that β-D-glucans prevent constipation, reduce the risk of colon cancer, produce short-chain fatty acids, lower blood cholesterol and glucose, reduce insulin, and control diabetes, and reduce risk factors for obesity, hyperlipidemia, hypertension cardiovascular disease, and cancer. They also improve the immune system, activate leukocytes, exert anti-tumor effects and inhibit the spread of HIV activity. The polysaccharides chitin and chitosan, found in the cell wall of mushrooms, have medicinal properties as they play an essential role in regulating hepatic function [56]. Various factors, including the steps of extraction, temperature, solids to solvent ratio, and particle size, may affect the extraction rate of active compounds from plants. Therefore, optimizing extraction conditions seem necessary [33]. The objective of this study was to optimize the extraction conditions for flavonoids, total phenols, antioxidant and antimicrobial compounds from G. lucidum by ultrasound pretreatment.
Materials and Methods
Materials
Ganoderma lucidum was purchased from a grocery in Qom, Iran. Their scientific names then were confirmed by the medicinal plants' Herbarium of the faculty of pharmacy, Tehran University. G. lucidum belongs to the Ganodermataceae family (voucher number 8346). Other chemicals include ethanol, ethyl acetate, ammonium chloride, potassium acetate, quercetin, Follin-Ciocalteu, sodium carbonate, 2-2-diphenyl -1-Picrylhydrazyl, Müller-Hinton broth, and Müller-Hinton agar were prepared from Merck Company (Germany). The used bacteria, including Escherichia coli, Staphylococcus aureus, and Clostridium perfringens were obtained from the microbial collection of the Iranian research organization for science and technology (IROST).
Reparation of G. Lucidum Mushroom
First, the G. lucidum mushrooms were rinsed and cut into small pieces. Next, they were dried in an oven (UF55/UN, Mommert Company, Germany) at 45C for 24 hours to reach a constant weight. They were turned into floury granules by a mill (ML-320P, Pars Khazar, Iran) and then sieved with mesh 16. The prepared powdered extract was stored in polyethylene containers in a dry place at 25 ℃ to prevent chemical changes caused by light.
Extraction of G. lucidum extract by ultrasound
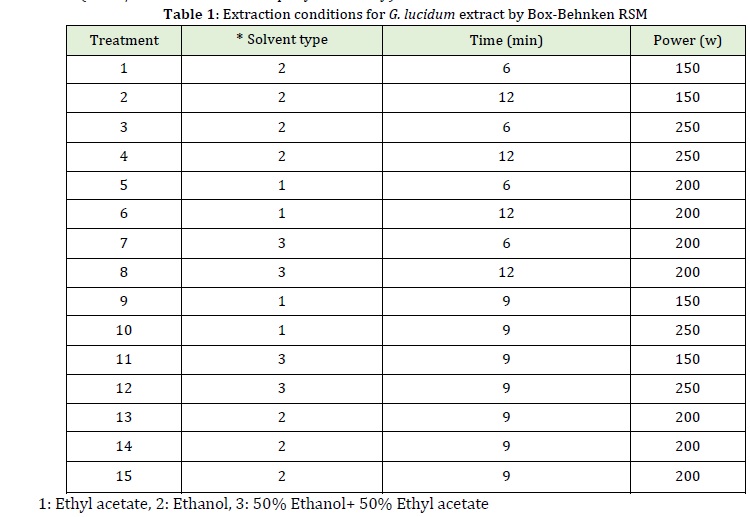
lucidum extract was extracted using Zhang et al. (2008) method with some modifications. First, 20 g of dried G. lucidum extract powder were mixed with the solvents (ethanol, ethyl acetate, 50:50 ethanol: ethyl acetate) in a ratio of 1:5 according to the treatments shown in Table 1. The prepared mixtures were pretreated at ultrasonic powers (W) and times (min) given in Table 1. The extracts were then filtered using Whatman filter paper No.1. The extracts obtained using organic solvents were concentrated by a rotary evaporator (EKA overy 10) at 40 ℃ to reach 60o Brix.
Measurement of Total Flavonoid Content
Total flavonoid content was measured by calorimetry. 0.5 mL of the extract was dissolved in 1.5 mL of methanol in a test tube to which 0.1 mL of 10% aluminum chloride and 0.1 mL of 1 M potassium acetate solution were added. Finally, 2.8 mL of distilled water was added, kept at room temperature for 30 min, and then the absorbance of the resulting mixture was read at 415 nm by UV-Vis spectrophotometer (Cary-300, Varian). Quercetin (Merck, Germany) was used as the standard to draw the calibration curve. The flavonoid content was expressed based on quercetin equivalent per gram of dry sample [4].
Measurement of total phenolic content
Phenolic content was determined by Folin-Ciocattea method. First, 1 mg/mL of each extract was prepared. Then 0.5 mL of each extract was mixed with 2.5 mL of 0.2 normal Folin-Ciocalteu reagent and stirred for 5 min. 2 mL of a sodium carbonate solution was added at a concentration of 7/5%. It was kept at room temperature for 2 h, the absorbance was read at 760 nm by UV spectrophotometer (UV2100, US). The results were expressed as gallic acid equivalent, and the final result was reported as the total phenolic content in mg gallic acid equivalent per gram of extract. To achieve the above results, mean absorbance was put in the line equation obtained from the standard gallic acid curve. Then standard gallic acid equivalents were obtained. The experiments were conducted in triplicate for each extract and standard [12].
Measurement of DPPH free radical scavenging activity
To determine the ability of G. lucidum to transfer hydrogen or electron, DPPH ethanolic solution bleaching assay was used. 2-2-diphenyl-1-picrylhydrazyl is a stable purple radical which is turned into yellow diphenylpicrylhydrazine when reduced by electron/ hydrogen donors (antioxidant compounds). 5 μL of the extract was mixed with 1000 μl of 0.135 mL M DPPH methanolic solution. The samples were then shaken for 1 min and placed in the dark for 30 min. Their absorbance was read at 517 nm by spectrophotometer (L800 Agualytic, Germany), and the percentage of free radical scavenging was calculated using Equation 1. The same procedure was repeated for control samples [57].

To better evaluate the antioxidant activity of the extract, the IC50 value, which indicates the concentration at which the extract can scavenge 50% of DPPH free radicals, was calculated.
Microbial Tests
The antimicrobial effect of the optimal treatment containing the highest amount of phenols, flavonoids, and antioxidant activity was examined by non-growth halo (zone of inhibition), agar well diffusion, and disc diffusion methods against E. coli, S. aureus, and C. perfringens.
96-well microplate investigated the antimicrobial properties of the extracts investigated the antimicrobial properties of the extracts investigated the antimicrobial properties of the extracts. To do so, the first 95μL of Müller-Hinton broth and 5 μL of the bacterial suspension corresponding to 0.5 McFarland standard were added to each well of ELISA plate. Then 100 μL of serial dilutions of the extract were added. The samples were mixed by shaker (30 rpm, 20 s), incubated at 37 ℃ for 24 h, the turbidity was read at 540 nm by ELISA (EL×800, Biotech company, USA). The concentration that showed no turbidity was selected as minimum inhibitory concentration (MIC). Next, the samples from wells exhibiting no turbidity were subcultured on Müller-Hinton broth medium serial dilution performed colony count. The first tube showing a reduction in a bacterial number greater than 0.0001 compared to the zero time of the control tube was determined to be the minimum lethal concentration (MBC). Also, tetracycline antibiotics to samples was used [21].
Identification of phenolic acid components by high-performance liquid chromatography (HPLC)
Phenolic compounds were isolated and identified using the Mello method Mello by HPLC (Model HPLC 1100, Agilent Company) equipped with a diode array detector at 260 nm. To do this, 100 μL of each solution was injected into the chromatogram device. The chromatographic assay was performed on a Eurospher C18 column (150×4.6 mm i.d., 3.5 μm, Waters). The mobile phase consisted of water: citric acid (1:19 V/V) as solvent A and Methanol as solvent B, at a constant flow rate of 1 mL/min. Chromatographic The gradient was started with 30% solvent B and continued with 60% within 45 minutes, 75% within 85 minutes, 90% within 95 minutes, and 30% within 105 min. The column temperature was kept constant at 30 °C, and the chromatogram was processed by Chemstate chromatography software (Agilent Company, USA).
Statistical analysis
15 treatments were designed by the Box-Behnken response surface methodology. To analyze the data and optimize the extraction conditions for antioxidant compounds from G. lucidum, Box-Behnken RSM, and Minitab software 16 at 95% confidence interval were used.
Result and Discussion
Variance analysis of response surface model for G. lucidum extract obtained under different conditions
Higher ultrasound power has the most significant effect compared to solvent and ultrasonic time. As seen in Table 2, the linear effect of all three variables, i.e., ultrasonic power, ultrasonic time, and type of solvent and the quadratic effect of type of solvent on the flavonoid content of G. lucidum extract was significant (P≤0.05). However, the quadratic effects of ultrasonic power and ultrasonic time and interaction effect (time, power, type of solvent) on the flavonoid content of G. lucidum extract were not significant (P>0.05). As indicated by the F value, the quadratic effect of the type of solvent had the most excellent effect on the total phenolic content of G. lucidum extract obtained by ultrasonic pretreatment followed by its quadratic effect.
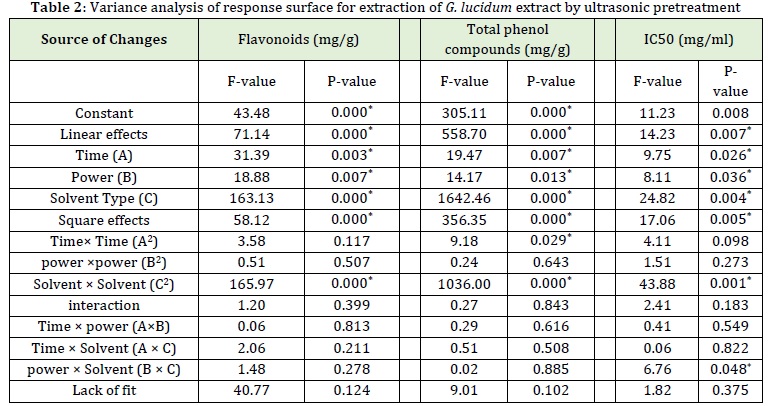
As shown in Table 2, the linear effect of all three variables, i.e., ultrasonic power, ultrasonic time, and type of solvent, as well as the quadratic effect of type of solvent and ultrasonic time on the total phenol compounds of G. lucidum extract, was significant (P≤0.05). However, the quadratic effects of ultrasonic power and interaction effect (time, power, type of solvent) on the total phenol compound content of G. lucidum extract were not significant (P>0.05). As indicated by the F value, the linear effect of the type of solvent had the most significant effect on the total phenolic content of G. lucidum extract obtained by ultrasonic pretreatment followed by its quadratic effect.
Given the results of the linear effect of ultrasonic power, ultrasonic time, and the type of solvent, the quadratic effect of the type of solvent and the interaction effect of the type of solvent × ultrasonic power on IC50 of the G. lucidum extract was significant (P≤0.05). In contrast, the quadratic effect of ultrasonic power and time and the interaction effects of the type of solvent× time and ultrasonic power×time on IC50 of the G. lucidum extract were not significant (P>0.05). As indicated by the F value, the quadratic effect of the type of solvent had the greatest effect on IC50 (mg/mL) of the G. lucidum extract obtained by the ultrasonic method.
Polynomial model of G. lucidum extract obtained under different conditions
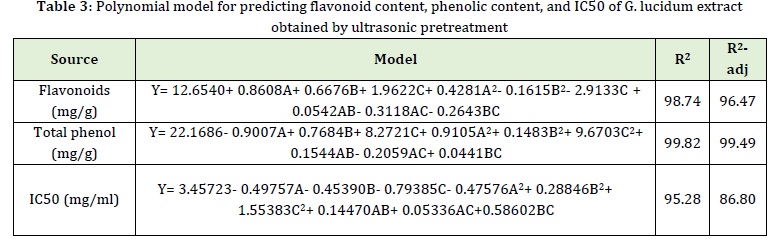
The polynomial model of flavonoid content is demonstrated in Table 3. The coefficient of explanation (R2) and the adjusted coefficient of explanation (R2-adj) was 98.74% and 96.47 %, respectively indicating the excellent fit of the model to the experimental data.
The polynomial model of total phenolic content is presented in Table 3. The coefficient of explanation (R2) and the adjusted coefficient of explanation (R2-adj) was 99.82 % and 99.49 % respectively, indicating the good fit of the model to the experimental data.
The polynomial model of IC50 is revealed in Table 3. As presented in Table 3, the coefficient of explanation (R2) and the adjusted coefficient of explanation (R2-adj) was 95.28 % and 86.80%, respectively, indicating the excellent fit of the model to the experimental data.
Flavonoid Content of G. Lucidum Extract Obtained by Ultrasonic Pretreatment
Phenolic compounds consist of simple phenols with an aromatic ring having at least one hydroxy group known as polyphenols. Polyphenols with two phenolic components form flavonoids [30].
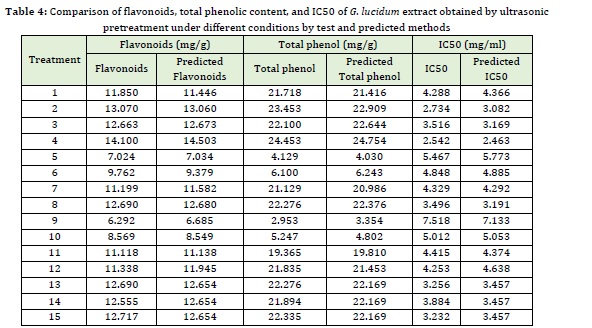
The flavonoid content of G. lucidum extract obtained by ultrasonic pretreatment under different conditions by test method, and the predicted values are presented in Table 4. As shown in the Table, different extraction conditions (ultrasonic power, ultrasonic time, and type of solvent) significantly affected the flavonoid content as it ranged from 6.2292 to 14.1 mg/g. The highest flavonoid content was obtained with ultrasonic power of 250 W, extraction time of 12 min, and ethanol were used. The lowest flavonoid content (6.229 mg/g) was obtained using ultrasonic power of 150 W, ultrasonic time of 9 min, and ethyl acetate solvent.
Type of solvent, ultrasonic power, and time had a significant (P≤0.05) effect on the flavonoid content. The mechanical oscillations in the G. lucidum matrix and the alternating cycles of contraction and expansion lead to the breakdown of cell wall and membrane and higher penetration of solvent into the cell. Due to the polarity of flavonoids and ethanol solvent, the dissolution of these compounds in the solvent increased, increasing the extraction of active compounds [51]. The increase in the flavonoid content with increasing ultrasonic time could be the cavitation phenomenon that results in the cell breakdown and homogenization of the solution. Therefore, the solutes diffuse rapidly from the solid phase to the solvent. It should be noted that a longer ultrasonic time may reduce the extraction yield due to the occurrence of oxidation (because of exposure to ultrasonic waves) [43].
Ashraf Yorghaloo et al. (2015) studied the antioxidant properties of grape pomace extract fermented with Aspergillus oryzae by ultrasonic pretreatment. The results revealed that the phenolic and flavonoid content were increased by enhancing the temperature and solvent concentration. The highest flavonoid content (71.81mg /g) was observed at 64℃ for 30 min and using a solvent concentration of 46%. Sardroodian (2016) reported the positive effect of ultrasound on the extraction of flavonoids from oleaster and stated that longer extraction time increased the extraction efficiency of flavonoids due to the increased time required for mass transfer during the extraction process. Guandalini et al. (2018) studied the successive extraction of phenols and pectin from mango peel by ultrasound. The results showed that the application of ultrasound had no significant effect on extraction efficiency.
Total phenolic content of G. lucidum extract obtained by ultrasonic pretreatment
Phenols are a class of compounds consisting of one or more hydroxyl groups bounded to an aromatic (nonpolar) ring, and this spatial structure distinguishes phenols based on their polarity. Therefore, the solubility of phenols insolvent can be explained by the spatial structure (polar and nonpolar) and the intermolecular force (hydrogen bond) between the phenols and solvent [15]. Total phenolic content of G. lucidum extract obtained by ultrasonic pretreatment under different conditions by test method, and the predicted values are presented in Table 4. As shown in the Table, different extraction conditions (ultrasonic power, ultrasonic time, and type of solvent) significantly affected total phenolic content as it ranged from 2.953 to 24.453 mg/g. The highest total phenolic content (24.453mg/g) was obtained using the ultrasonic power of 250 W, ultrasonic time of 9 min, and ethyl acetate solvent. The similarity of the polarity of phenols with that of ethanol solvent is the most crucial reason for the increased extraction of phenolic content. Also, the cavitation phenomenon occurring by the solvent in the ultrasound-assisted extraction results in an increase in the extraction of phenols [19]. Studies conducted by Jung et al. (2011) and Akhbari et al. (2019) showed that 70 % ethanol was more efficient than water and methanol for phenols extraction from eggplant skin which agrees with the results of the present study. Kabiri et al. (2019) investigated the phenolic compounds of Melissa officinalis leaves by microwave pretreatment with three solvents (water, methanol, and ethanol) at different extraction times and reported that the ethanolic and aqueous extracts showed the highest and the lowest extraction efficiency, respectively being consistent with our results. The results revealed that the extraction time had a significant (P≤0.05) effect on the extraction yield because the solvent has time to penetrate the plant tissue and the phenols have enough time to separate from their substrate and diffuse the surrounding solvent. Chekin and Roozbahani (2016) and Ma et al. (2009) investigated the phenolic content of the aqueous extracts of tea and tangerine, respectively, extracted by ultrasound-assisted method and reported that with increasing ultrasonic time, the higher number of phenolic compounds were extracted which are in consistence with the results obtained in this study.
IC50 of G. lucidum extract obtained by ultrasonic pretreatment
IC50 value in DPPH radical scavenging test refers to the concentration of antioxidant extract that can scavenge 50% of the primary free radicals. So, lower IC50 indicates more significant antioxidant potential (a small sample can scavenge a large number of free radicals) (Vatai et al., 2009). The IC50 value of G. lucidum extract obtained by ultrasonic pretreatment under different conditions by the test method and the predicted values are given in Table 4. As shown in the Table, different extraction conditions (ultrasonic power, ultrasonic time, and type of solvent) had a significant (p≤0.05) effect on the IC50 value of G. lucidum extract as it ranged from 2.542 to 7.518% mg/mL. The lowest IC50 (2.542%) was observed using ultrasonic power of 250 W, ultrasonic time of 12 min, and ethanol solvent, and the highest IC50 or the lowest rate of free radical scavenging (7.518%) was obtained by ultrasonic power of 150 W, ultrasonic time of 9 min and ethyl acetate solvent. It was depicted that the extraction conditions that increased the amounts of phenols and flavonoids also showed the highest antioxidant activity indicating a high correlation between phenolic content and antioxidant properties. G. lucidum extract is rich in phenolic compounds that can scavenge free radicals because of hydroxyl groups and transfer electron or hydrogen. Since with increasing ultrasonic time and power and by using methanol solvent higher phenolic content was found in G. lucidum extract, higher amount of antioxidant compounds scavenging free radicals is expected, so lower IC50 value is observed when using longer ultrasonic time, increased ultrasonic power, and methanol solvent [18]. Mozdastan et al. (2015) studied the effect of the ultrasound-assisted extraction with methanol solvent on Myrtus commnis leaves' antioxidant activity. They stated that the highest free radical scavenging rate was 335.1 g/mL. Saifullah et al., (2020) reported that the IC50 value of the Aloysia citrodora leaves extracted under optimal conditions (50 ℃, 60 min 200 W) by the DPPH method was 889.29% and stated that the application of ultrasound was the most effective in extracting phenols and exerting the antioxidant effect. Ezzatzadeh et al., (2012) investigated the antimicrobial and antioxidant properties of Artemisia kulbadica (A. kulbadica) and reported that A. kulbadica and some of its isolates one separately possesses antimicrobial or antioxidant properties and may act as a potential antioxidant for biological systems.
Wang et al. (2008) investigated the effect of the ultrasonic process on the antioxidant capacity of kiwifruit extract. They reported that increased ultrasonic power and time significantly affected the increased antioxidant capacity.
Single optimization of extraction conditions for G. lucidum extract by ultrasonic pretreatment
Figure 1(a) shows the optimal conditions for obtaining the maximum number of flavonoids in G. lucidum extract by ultrasonic pretreatment. The maximum number of flavonoids was predicted to be 14.5032 mg/g with 100% desirability at ultrasonic power of 250 W for 12 min using ethanol solvent. Flavonoid content of 14.1 mg/g was obtained under the laboratory optimal condition showing no significant (p>0.05) difference from the value predicted by RSM.
Figure 1(b) shows the optimal conditions for obtaining the maximum total phenolic content in G. lucidum extracted by ultrasonic pretreatment. The maximum amount of total phenols was predicted to be 24.7544 mg/g with 96.900% desirability at ultrasonic power of 250 W for 12 min using ethanol solvent. Total phenolic content of 24.423 mg/g was obtained under the optimal laboratory conditions showing no significant (p>0.05) difference from the value predicted by RSM.
Figure 1(C) shows the optimal conditions for obtaining the maximum number of antioxidants (the lowest IC50 value) in G. lucidum extract by ultrasonic pretreatment. The lowest IC50 value was predicted to be 2.3987 mg/mL with 100% desirability at ultrasonic power of 250 W for 12 min using ethanol solvent. IC50 value 2.487 mg/mL was obtained under optimal laboratory conditions showing no significant (p>0.05) difference from the value predicted by RSM.
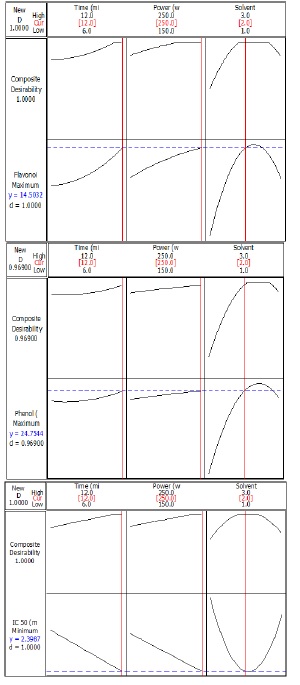
Figure 1: Diagram of single optimization of (a) flavonoid content, (b) total phenolic content, (c) IC50 of G. lucidum extract by ultrasonic pretreatment
Simultaneous optimization of extraction conditions for G. lucidum extract by ultrasonic pretreatment
Optimization of the extraction conditions for G. lucidum extract by ultrasonic pretreatment for obtaining the maximum amount of flavonoid, total phenolic content and the lowest IC50 with 100% desirability simultaneously was predicted at ultrasonic power of 250 W for 12 min using ethanol solvent (Figure 2). Under the conditions mentioned above, flavonoid content of 14.3348 mg/g, total phenolic content of 24.6684 mg/g, and IC50 of 2.3987 mg/mL were obtained showing no significant (p>0.05) difference from the values predicted by RSM.

Figure 2: Simultaneous optimization of flavonoid content, total phenolic content, and IC50 of G. lucidum extract by ultrasonic pretreatment under different conditions
Antimicrobial effects of G. lucidum extract obtained by ultrasonic pretreatment
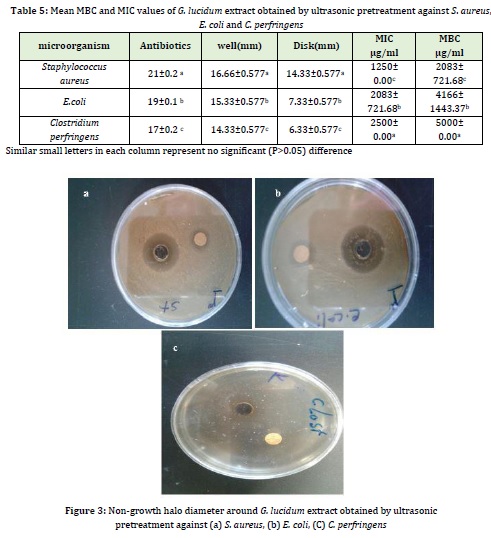
Simultaneously optimized conditions for obtaining the maximum amount of flavonoid, total phenolic content, and IC50 were selected for G. lucidum extraction. The antimicrobial effects of the above optimal treatment were investigated by disc and well diffusion methods against E. coli, S. aureus, and C. perfringens (Figure3).
Table 5 represents the minimum inhibitory concentration (MIC) and the minimum bactericidal concentration (MBC) of the predicted optimal treatment using ultrasonic pretreatment against S. aureus, E. coli, and C. perfringens. The results showed a significant (p<0.05) difference between MIC and MBC of G. lucidum extract against C. perfringens, E. coli, and S. aureus. The lowest mean MBC and the minimum MBC were 1250 and 2083 μg/mL, respectively, against S. aureus and the highest mean MIC and the minimum MIC were 2500 and 5000 μg/mL, respectively, against C. perfringens. Using ultrasound pretreatment, the predicted optimal treatment had a better antimicrobial effect on S. aureus with the most prominent non-growth halo (zone of inhibition) (14.33 mm) compared to E. coli and C. perfringens. Also the non-growth halo of tetracycline disc growth was on Escherichia coli 19 mm, Clostridium perfringens 17 mm, and Staphylococcus aureus 21 mm. The ultrasound-assisted extracted extracts had antimicrobial activity because of having higher phenolic content. The inhibitory effects of phenolic compounds depend on the adsorption of cell membranes, reaction to enzymes, substrate, and metal ions [11]. They bind to phospholipids of the cell membrane, thereby reducing the selective permeability and increasing the membrane's permeability, so the cellular components leave the cell impairing the energy metabolism. Also, the uptake of nutrients by the microbial cell and electron transfer in the cell and the synthesis of genetic material are altered [6].
Ezzatzadeh et al. (2014) investigated the antimicrobial effects of root, leaf, and aerial essential oils from N. asterotricha. The results of the bioassays showed the interesting antimicrobial activity, in which the Gram-positive bacteria, Bacillus cereus, and Staphylococcus aureus, were the most sensitive to the oils, as well the oils exhibited remarkable antifungal activity against all the tested fungi.
Using the agar diffusion method, Dorantes et al. (2000) reported that the Capsicum annuum extract inhibitory Salmonella Typhimurium, Listeria monocytogenes Staphylococcus aureus, and Bacillus cereus. Pervin et al. (2013) studied the antibacterial effect of V.corymbosom leaves extract on the standard strain of S.typhimurium and reported the non-growth halo diameter of 23 mL for a concentration of 10 mg in each disc. Shirmohammadi and Zarringhalami (2017) examined the effect of the ultrasound-assisted extraction method on the antimicrobial activity of ethanolic extract of flaxseed powder. They reported that the obtained extract had the highest antioxidant property by applying ultrasonic waves for 30 min. It was demonstrated that the extract could control the growth of E. coli and S. aureus with a non-growth halo diameter of 9 and 6 mL, respectively.
Identification of phenolic compounds of G. lucidum extract
The type and number of phenolic compounds of G. lucidum extract are shown in Table 6 and Figure 4, respectively. Gallic acid (229.57 μg/mL) and chlorogenic acid (178.16 μg/mL) were the predominant phenolic compounds in G. lucidum extract.

Phenolic acids are hydroxylated derivatives of benzoic acid and cinnamic acid. Hydroxycinnamic acids are found abundantly in most living organisms, with the most common ones being chlorogenic acid, caffeic acid, and ferulic acid. Most studies have reported a link between the healthful properties of phenolic acids and their antioxidant activity (Mattila and Hellstrom, 2007). Hydroxycinnamic acids have higher antioxidant activity than hydroxybenzoic acids due to the presence of a propenoic side chain instead of a carboxyl group (Natella et al., 1999). The researchers stated that hydroxycinnamic acid derivatives such as caffeic acid and ferulic acid had effective radical scavenging activity [3,52]. Flavonoids are the most potent antioxidant among phenolic compounds. They are potent scavengers of hydroxyl and peroxide and their effect on superoxide radicals has not yet been determined [31]. Quercetin is a flavonol and is one of the most powerful natural antioxidants. The increased number of hydroxyl groups is directly related to the antioxidant power of flavonoids [48]. Rutin, quercetin, and luteolin have medicinal, antibacterial, and antioxidant properties such that luteolin can reduce cholesterol synthesis by indirect interference with cholesterol synthesis and by inhibiting haptic hydroxymethyl gutaryl-CoA reductase enzyme. Cynarine is also one of the dicaffeil quinic derivatives with a high level of antioxidant and anti-cholesterol activity [17]. The antioxidant effects of quercetin are caused by the chelation of metals, scavenging free radicals, and stimulating the expression of protective enzymes [3,52]. Rutin is a natural food pigment, stabilizer, and preservative used in various industries. It has various biological activities, including antioxidant, anti-inflammatory, and protective effects on the liver, beneficial to human health [48]. Therefore, studying these compounds in G. lucidum extract was crucial to emphasize their medicinal, nutritional, and antioxidant properties. The chromatogram of the analyzed phenolic compounds of G. lucidum extract will be presented in the following section.
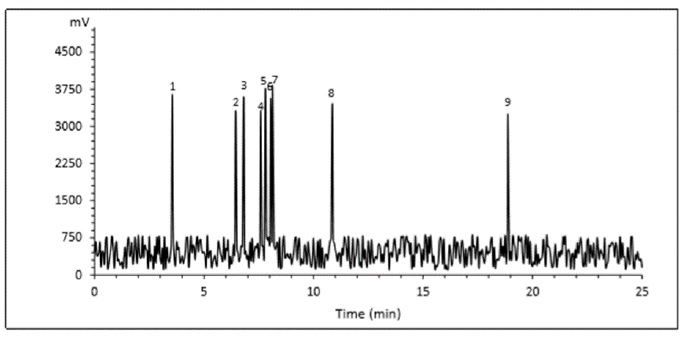
Figure 4: Chromatogram of identified phenolic acids
*Peaks 1-9 are presented in Table 6.
Zengin et al. (2015) studied the phenolic compounds of Ganoderma applanatum and Ganoderma resiaceum and reported that methanolic extracts of both plants contained protocatechuic acid, catechin, chlorogenic acid, and ferulic acid. Helena et al. (2012) also examined the phenolic acids of G. lucidum and showed that the G. lucidum extract contained P-hydroxybenzoic acid, P-coumaric acid, and cinnamic acid. Oludemi et al. (2017) studied the phenolic acids of G. lucidum and stated that the significant identified components included P-hydroxybenzoic acid and syringic acid. Veljovic et al. (2017) also stated that the most predominant phenolic compounds of G. lucidum were gallic acid, trans-cinnamic acid, quercetin, kaempferol, hesperidin, and naringin. Dong et al. (2019) also investigated the phenolic compounds of G. lucidum extract and reported that the identified phenols were kaempferol, cinnamic acid, quercetin, coumaric acid, and rutin. Costa et al. (2018) studied the phenolic compounds of G. lipsiense and stated that caffeic acid, syringic acid, P-coumaric acid, salicylic acid, and ferulic acid were the significant phenols. Similarly, Si et al. (2018) stated that in addition to mannose, rhamnose, and glucose, G. lingzhi mushroom extract contained a considerable amount of uric acid, which plays a role in chelating metals and trapping free radicals thereby reducing the occurrence of oxidation. Hye Ryu et al. (2020) also showed that G. lucidum contained ganoderic acid and lucidenic acid.
Conclusion
This study aimed at optimizing the extraction of G. lucidum extract by ultrasonic pretreatment and measuring flavonoids, total phenolic content, antioxidant and antimicrobial compounds under different conditions, including type of solvent, ultrasonic power, and ultrasonic time. The results showed that using ultrasonic waves, longer ultrasonic time, and ethanol solvent significantly increased the extraction of flavonoids and total phenols and decreased IC50 (mg/mL) as the highest flavonoid content (14.1 mg/g), total phenolic content (24.453 mg/g) and the lowest IC50 (2.542 mg/mL) were obtained using ultrasonic power of 250 W, ultrasonic time of 12 min and ethanol solvent. So, ultrasound could be an appropriate technique for extracting active compounds from G. lucidum extract. Given the potential antioxidant activity and a significant number of flavonoids and phenolic compounds, G. lucidum could be used in food, pharmaceutical, and beverage industries in place of synthetic antioxidants.
Funding
This research did not receive any specific grant from funding agencies in the public, commercial, or not-for-profit sectors.
Authors' contributions
All authors contributed toward data analysis, drafting and revising the paper and agreed to be responsible for all the aspects of this work.
Conflict of Interest
We have no conflicts of interest to disclose.
ORCID
Leila Nateghi:
https://www.orcid.org/0000-0001-8937-8728
HOW TO CITE THIS ARTICLE
Mohammad Masjedi, Leila Nateghi, Shila Berenjy, Mohammad Reza Eshaghi, Determination of Antioxidant and Antimicrobial Compounds of Ganoderma lucidum Extract in Laboratory Different Conditions
Running Title: Determination of Antioxidant and Antimicrobial Compounds of Ganoderma lucidum. Chem. Methodol., 2022, 6(3) 212-227
DOI: 10.22034/chemm.2022.316157.1398
- Akbari M., Hamedi S., Aghamiri Z.S., Food Measure. Character., 2019, 13:3183 [Crossref], [Google scholar], [Publisher]
- Ashrafi Yorghanloo R., Rezazadbari M., Alizadeh Khaledabad M., Pourakbar L., Food Health., 2015, 4:65 [Publisher]
- Andreasen M.F., Landbo A.K., Christensen L.P., Hansen Å., Meyer, A.S., Agri. Food Chem., 2001, 49:4090 [Crossref], [Google scholar], [Publisher]
- Chang C.C., Yang M.H., Wen H.M., Chern J.C., J Food Drug Anal., 2002, 10:178 [Crossref], [Google scholar], [Publisher]
- Chekin F., Karimi Roozbahani N., Food Process Prod., 2016, 6:1 [Publisher]
- Chitra K., Venkatesh R., Dhanalakshmi K., Sharavanan P.T., Bali Sasikumar C., Karthikeyani Vijayakumari K., J. Curr. Microbiol. App. Sci., 2018, 7:379 [Crossref], [Google scholar], [Publisher]
- Costa T.M., Kaufmann V., Paganelli C.J., Siebert D.A., Micke G.A., Alberton M.D., de Oliveira D., Bioprocess Biosys. Eng., 2019, 42:1325 [Crossref], [Google scholar], [Publisher]
- Davari A., Solouki M., Fazelinasab B., Eco Phytochemistry J. Med. Plant., 2018, 5:1 [Google scholar]
- Dong Q., He D., Ni X., Zhou H., Yang H., Food Meas. Charact., 2019, 13:3198 [Crossref], [Google scholar], [Publisher]
- Dorantes L., Colmenero R., Hernandez H., Mota L., Jaramillo M.E., Fernandez E., Salano C., J. Food Microbiol., 2000, 57:125 [Crossref], [Google scholar], [Publisher].
- Duman A.D., Ozgen M., Dayisoylu K.S., Erbil N., Durgac C., Mol., 2009, 14:17 [Crossref], [Google scholar], [Publisher]
- Ebrahimzadeh M.A., Pourmorad F., Hafezi S., Pak J. Biol. Sci., 2009, 12:447 [Crossref], [Google scholar], [Publisher]
- Ezzatzadeh E., Fallah S., Pourghasem E., Rustaiyan A., Zarezadeh A., Ess. Oil-Bear. Plants, 2014, 17:415 [Crossref], [Google scholar], [Publisher]
- Ezzatzadeh E., Hossin Farjam m., Rustaiyan A., Asian Pac. J. Trop. Dis., 2012, 2:S431 [Crossref], [Google scholar], [Publisher]
- Galanakis C.M., Goulas V., Tsakona S., Manganarisl G.A., Gekas V., Purif. Technol., 2013, 107:245 [Crossref], [Google scholar], [Publisher]
- Gao Y., Lan J., Dai X., Ye J., Zhou S. H., J. Med. Mushrooms, 2004, 6:33 [Crossref], [Google scholar], [Publisher]
- Gebhardt R., Pharmacol. Exp. Ther., 1998, 286:122 [Google scholar], [Publisher]
- Ghasemi K., Ghasemi Y., Ebrahimzadeh M.A., Pak J. Pharm. Sci., 2009, 22:277 [Google scholar], [Publisher]
- Ghasemzadeh A., Jaafar H.Z., Juraimi A.S., Tayebi-Meigooni A., Molecules, 2015, 20:10822 [Crossref], [Google scholar], [Publisher]
- Guandalini B.B.V., Rodrigues N.P., Marczak L.D., Food Res. Int., 2018, 119:455 [Crossref], [Google scholar], [Publisher]
- Harikrishnan R., Nisha R.M., Balasundaram C., Aquaculture, 2003, 221:41 [Crossref], [Google scholar], [Publisher].
- Hakimi L., Masoumi Goodarzi M., Plant Prod., 2020, 43:117 [Crossref], [Google scholar], [Publisher]
- Heleno S.A., Barros L., Martins A., Queiroz M.J.R., Santos-Buelga C., Ferreira I.C. Food Res. Int., 2012, 46:135 [Crossref], [Google scholar], [Publisher]
- Hossain M.B., Brunton N.P., Patras A., Tiwari B.O., Donnell C.P., Martin Diana A.B., Barry-Ryan V., Sonochem., 2012, 19:582 [Crossref], [Google scholar], [Publisher]
- Hye Ryu D., Yeong Cho J., Bin Sadiq N., Kim J.C., Lee B., Hamayun M., Sung Lee T., Seok Kim H., Hyun Park S., Won Nho C., Kim H.Y., Food Chem., 2020, 335:127645 [Crossref], [Google scholar], [Publisher]
- Jabernia H., Piri K.H., Nazai J., Food Chem., 2013, 136:237 [Crossref], [Google scholar], [Publisher]
- Jerković I., Mastelić J., Marijanović Z., Klein Ž., Jelić M., Sonochem., 2007, 14:750 [Crossref], [Google scholar], [Publisher]
- Jung E.J., Bae M.S., Jo E.K., Jo Y.H., Lee S.C., Med. Plant Res., 2011, 5:4610 [Crossref], [Google scholar], [Publisher]
- Kabiri S., Seyyed Alangi S.Z., food Technol., 2015, 4:23 [Crossref], [Google scholar], [Publisher]
- Khalili M., Ebrahimzadeh M.A., Mazandaran Univ. Med. Sci., 2015, 24:188 [Google scholar], [Publisher]
- Koda T., Kuroda Y., Imai H., Res., 2008, 28:629 [Crossref], [Google scholar], [Publisher]
- Lamina S., Ezema C.I., Theresa A.I., Anthonia E.U., Antioxid. Med. Sci., 2013, 2:83 [Google scholar], [Publisher]
- Liu G., Zhuang L., Song D., Lu C., Separat. Sci., 2017, 40:472 [Crossref], [Google scholar], [Publisher]
- Ma Y.Q., Chen J.C., Liu D.H., Ye X.Q., Sonochem., 2009, 16:57 [Crossref], [Google scholar], [Publisher]
- Mattila P., Hellstrom J., Food Compos. Analys., 2007, 20:152 [Crossref], [Google scholar], [Publisher]
- Mayzumi F., Okamoto H., Mizuno T., Food Rev. Int., 1997, 13:365 [Crossref], [Google scholar], [Publisher]
- Mello B.C.B.S., Petrus J.C.C., Hubinger M.D., Food Eng., 2010, 96:533 [Crossref], [Google scholar], [Publisher]
- Moghimi M., Farzaneh V., Bakhshabadi, H., Nutrire, 2018, 4:2 [Crossref], [Google scholar], [Publisher]
- Mozdastan S., Ebrahimzade M.A., Khalili M., Mazandaran Univ. Med. Sci., 2015, 25:10 [Google scholar], [Publisher]
- Oludemi T., Barros L., Prieto M.A., Heleno S.A., Barreiro M.F., Ferreira I.C., Food Funct., 2018, 9:209 [Crossref], [Google scholar], [Publisher]
- Pervin M., Hasnat M.A., Lim B.O., Asian Pac. J. Trop. Dis., 2013, 3:444 [Crossref], [Google scholar], [Publisher]
- Mahboubi M., Kazempour N., Songklanakarin J. Sci. Technol., 2014, 36:83 [Google scholar]
- Rostagno M.A., Palma M., Barroso C.G., Chromatogr. A, 2003, 1012:119 [Crossref], [Google scholar], [Publisher]
- Saifullah M., Mccullum R., Mccluskey A., Vuong Q., Heliyon, 2020, 6:03666 [Crossref], [Google scholar], [Publisher]
- Sardroodian M., Mehraban M., Aryanfar A., Eco Phytochemistry of medicinal herbs., 2016, 4:79 [Publisher]
- Sherafati-chaleshati R., Sherafati-chaleshati F., Sherafati-Chaleshati A., Ashrafi K., Shahrekord Univ. Med. Sci., 2009, 11:37 [Google scholar]
- Shirmohammadi M., Zarringhalami S., Food Sci. Indust., 2017, 67:11 [Google scholar]
- Sadeghi Mahoonak A., Salmanian Sh., Ghorbani M., Alami M., J. Nutr. Sci. Food Indust., 2013, 8:177 [Google scholar]
- Si J., Meng G., Wu Y., Ma H.F., Cui B.K., Dai Y.C., J. Biol. Macromol., 2019, 124:1186 [Crossref], [Google scholar], [Publisher]
- Veljović S., Veljović M., Nikićević N., Saša Despotović S., Radulović S., Nikšić M., Filipović L., Food Sci. Technol., 2017, 54:1312 [Crossref], [Google scholar], [Publisher]
- Vilkhu K., Mawson R., Simons L., Bates D., Innovative Food Sci. Emerg. Technol., 2008, 9:161 [Crossref], [Google scholar], [Publisher]
- Vuorela S. Meyer A.S., Heinonen M., Agri. Food Chem., 2004, 52:8202 [Crossref], [Google scholar], [Publisher]
- Wang L., Weller C.L., Trends Food Sci. Technol., 2006, 17:300 [Crossref], [Google scholar], [Publisher]
- Wang J., Sun B., Cao Y., Tian Y., Li X., Food Chem., 2008, 106:804 [Crossref], [Google scholar], [Publisher]
- Williams G.M., Iatropoulos M.J., Whysner J., Food Chem. Toxicol., 1999, 37:1027 [Crossref], [Google scholar], [Publisher]
- Sohretoglu D., Huang Sh., Anticancer Agents Med. Chem. 2018, 18:667 [Crossref], [Google scholar], [Publisher]
- Yao X., Zhang D., Zu Y., Fu Y., Luo M., Gu C., Li C. M. F., Efferth T., Crops Produc., 2013, 49:247 [Crossref], [Google scholar], [Publisher]
- Zengin G., Sarikurkcu C., Gunes E., Uysal A., Ceylan R., Uysal S., Aktumsek A., Food Funct., 2015, 6:2794 [Crossref], [Google scholar], [Publisher]
- Zhang Y., Seeram N.P., Feng L., Agri. food Chem., 2008, 56:670 [Crossref], [Google scholar], [Publisher]
)