Document Type : Original Article
Authors
1 Department of Applied Chemistry, Faculty of Science, South Tehran Branch, Islamic Azad University, Tehran, Iran
2 Department of Polymer and Textile Engineering, South Tehran Branch, Islamic Azad University, Tehran, Iran
3 Department of Polymer and Chemical Engineering, South Tehran Branch, Islamic Azad University, Tehran, Iran
4 Nanotechnology Research Center, South Tehran Branch, Islamic Azad University, Tehran, Iran
Abstract
Nanocatalyst materials can achieve a synergistic effect through complementarity components, which are essential for improving electrode performance. In this research, a novel anode electrode (G-ZSM-5/Fe/Ni) was made by modifying the surface of a simple graphite rod electrode with a ZSM-5/Fe/Ni nanocatalyst to increase the efficiency of microbial fuel cells. The results of cyclic voltammetry (CV) and square wave voltammetry (Sqw) analysis showed a 27.95% increase in the current efficiency of this electrode compared to the simple graphite electrode. Electrode modifications with conductive and nanostructured ZSM-5/Fe/Ni were recognized as an efficient approach to improve the interaction between electrode surface and bacteria and electrical conductivity for boosting the performance of microbial fuel cells (MFCs). Moreover, to optimize the influencing process parameters, three variables of temperature, retention time, and stirring rate were each investigated through the surface response method (RSM) with essential responses such as current output (I) and percentage of chemical oxygen demand removal efficiency, after which the best conditions were provided. In the proposed model, the temperature of 28 °C, the retention time of 37 h, and the stirring rate of 50 rpm were determined as optimal conditions, in which the maximum current production and the percentage of chemical oxygen demand removal efficiency were 1099 mA and 40.53%, respectively. Therefore, this synthesized nanocatalyst is a promising candidate as a biocompatible anode material in MFC.
Graphical Abstract
)
Keywords
Main Subjects
Introduction
Microbial fuel cell (MFC) technology as a bioelectrochemical system (BES) is considered one of the newest methods of producing electric current, organic matter recovery, wastewater treatment, and extraction of valuable by-products from wastewater by microorganisms [1-4].
High-efficiency guidance in MFCs requires high electrochemical activity, high extracellular electron transfer (EET), and effective interactions between electrodes and microbes to form a biofilm layer on the anode surface that depends on factors such as roughness, surface chemistry, porosity, and hydrophilicity of electrode and type of EET-capable bacteria [5-7].
Various modified electrodes based on various materials have been used to manufacture MFCs, including graphite electrodes, carbon cloth electrodes, carbon foam, lattice carbon, carbon paper, stainless steel, ceramic, 3D carbon electrodes. It has been shown that the MFC efficiency has been dramatically enhanced by extensive research with modifications such as increasing metal and nonmetal functional groups, resulting in increased specific surface area (SSA) and electrical conductivity [8-11]. The reason for using this type of base electrodes can be attributed to its chemical stability, low cost, high conductivity, and biocompatibility compared to other electrodes [12-13].
Given the importance of the subject mentioned above, extensive research has been carried out in this area in recent years. For example, Yellappa et al. [14] used anodic electrodes made of stainless steel modified with polyaniline-doped carbon nanotube (CNT) by in situ polymerization. Due to high specific surface area (SSA) than simple stainless-steel electrode and high electrocatalytic activity, this electrode increases the cell output power by up to 48% and the chemical oxygen demand removal efficiency by up to 80%. Xu et al. [15] used an anode with 3D porous nitrogen-chitosan modified with polyaniline/carbon nanotube. By forming the triple bonds, increasing the SSA, and facilitating the bacterial attachment on the anode surface, polyaniline increased power density from 1.4 W/m3 in the chitosan-carbon nanotube-nitrogen (NCNT/S) electrode to 4.2 W/m3 in the NCNT/S-PANI electrode. Zhai et al. [16] used surface modification technique for carbon cloth electrode with polyaniline nanostructures vertically bonded to carbon cloth to improve the interaction between the electrode surface and electrogenic bacteria using in situ polymerization method, which succeeded in increasing EET. Yin et al. [17] fabricated an anodic electrode of carbon cloth modified with polyaniline sheets to which titanium dioxide (TiO2) nanowires are vertically attached (TiO2-PANI/CP). Increasing the number of polyaniline sheets to 20 (TiO2-20PANI/CP) increased the output power density by 63% compared to the titanium dioxide /carbon cloth electrode (TiO2/CP). Li et al. [18] used graphene anode modified with titanium and polyaniline. Their results showed that titanium sub-oxides (Ti4O7) improved cell performance due to increased electrical conductivity and high electrochemical SSA, with output voltage and power density increasing 2.9 and 12.7 times in the MFC reactor with TSGP electrode, respectively, compared to the carbon cloth electrode. Tian et al. [19] developed MFC using graphene anode electrode modified with polypyrrole (PPy) and manganese dioxide (MnO2) nanoparticles and studied its performance at low temperatures of the reactor cell. After analyzing the conditions, the efficiency of chemical oxygen demand (COD) and CH4 gas produced by this bioelectrochemical system with surface-modified graphene electrode was increased to 43.9% and 66.3%, respectively, compared to pure graphene. The SEM images from the modified graphene electrode surface showed that the electrode had more SSA than the unmodified type, making it easier to attach the microbes and form thick and heavy biofilms on the electrode surface. Zeng et al. [20] prepared macro-sized nitrogen-modified carbonized cotton cloth anodes. Physicochemical results showed high SSA for bacterial growth and EET in this electrode. The maximum output power density of the cell by this modified anode was 80.5% higher than that of the MFC with a pure cotton anode. Jia et al. [21] used TiO2 nanowires/carbon paper (TiO2-NWs/ CP) anode electrode. Due to the increase of the two EET and SSA factors of an electrode, the cell production power with this electrode was increased by 49.5% compared to the CP electrode. Chang et al. [22]. Investigated the surface and electrochemical properties of carbon cloth electrode surface modified with atmospheric pressure plasma jets (APPJs) in MFCs. The power density of this electrode (7.56mW/m2) was increased significantly compared to the unmodified carbon cloth electrode (2.38mW/m2) due to the ease of biofilm formation on the surface of this electrode.
Graphite has a carbon crystalline structure with SP2 hybridization and has high electrical stability and conductivity that can be used as a base substrate to prepare new electrodes [23]. It is worth noting that among the various graphite electrodes (cloth, rod, foam, layered, and brush), the graphite rod electrode has a lower efficiency than other types of graphite [24-26].
Zeolites are tetrahedral crystalline aluminosilicates bonded with oxygen bridges; due to their SSA, specific channel structure, high thermal and hydrothermal stability, they are widely used in chemistry, petrochemicals, and water and wastewater treatment [27-29].
Considering the results obtained from research on electrode modification in MFCs and their reports on the potential impact of metal nanoparticles and their alloys as catalysts on the oxygen reduction reaction (ORR) as well as the low cost of these metals, [30-36], we investigated the efficiency of MFC with ZSM-5 nanozeolite surface modified graphite anode electrode doped with ferrous (Fe) and nickel (Ni) to increase output production current, chemical oxygen demand removal efficiency (%COD), improving graphite rod electrode efficiency, selecting an electrode with the highest efficiency, and determining optimum temperature, time and stirring rate using by response surface method (RSM).
Experimental
Materials
The ZSM-5 nanocatalyst powder (from the Zeolites family) was purchased from Sigma Aldrich with a crystal size of 0.5 μm and a pore size of 5.5Å. Ferric chloride (FeCl3), nickel sulfate (Ni2SO4), potassium chloride (KCl), sodium di-hydrogen phosphate dihydrate (NaH2PO4.2H2O), disodium hydrogen phosphate dihydrate (Na2HPO4.2H2O), ammonium chloride (NH4Cl), and 98% sulfuric acid (H2SO4) were also obtained from Merck Germany. Nafion117 membrane (DuPont, the USA) was used to Preparation the cell.
Preparation of ZSM-5/Fe and ZSM-5/Ni Nanocatalyst
To prepare the functionalized ZSM-5 nanocatalyst, the first 2.5 g of ZSM-5 nanozeolite powder was placed in the furnace at a temperature of 500 °C for 4 h and calcined. Then, 0.5 g of ferric chloride (FeCl3) powder or nickel sulfate (Ni2SO4) was dissolved in distilled water twice for 1 h, added to the calcined ZSM-5 nanozeolite powder mixed for another 30 min and filtered with a filter paper. The resulting powder was rinsed three times with distilled water and placed in an oven at a temperature of 80 °C for 2 h. Next, the powder was separated from the filter paper and re-calcined at a temperature of 500 °C for 4 h. The preparation method for each of the above nanocatalysts is schematically illustrated in Figure 1.
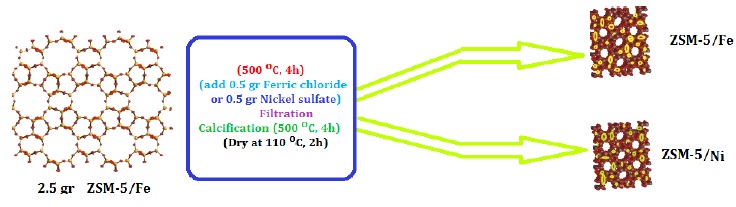
Figure 1: Schematic of the preparation process of ZSM-5/Fe and ZSM-5/Ni nanocatalysts
Preparation of ZSM-5/Fe/Ni Nanocatalyst
To produce ZSM-5/Fe/Ni nanocatalyst powder, ZSM-5 was first doped with Fe as previously mentioned, and then 0.5 g of nickel sulfate (Ni2SO4) powder was dissolved in deionized water for one hour. Next, the calcined ZSM-5/Fe nanozeolite powder was added and stirred for 30 min. Afterward, the solution was filtered, and the powder was washed three times with distilled water and placed in an oven at a temperature of 80 °C for 2 h. The resulting powder was re-filtered and placed in the furnace at a temperature of 500 °C for 4 h.
2.4. Materials Characterization
Infrared spectroscopy (Model Spectrum100 Perkin Elmer, the USA) was used to investigate the presence of ferrous (Fe) and nickel (Ni) metals in the nanocatalyst structure functionalized with these metals. Brunauer-Emmett-Teller (BET) surface area analysis (Belsorb apparatus, Japan) was used to determine the SSA of nanocatalyst particles, and X-ray diffraction (XRD, STADI-P, the USA) and energy-dispersive X-ray spectroscopy (EDX, MIRA III SAMX, Czech Republic) were applied to investigate the surface modification of the graphite electrode by each of the nanocatalysts.
Electrode Modification
To modify the graphite surface and impregnate with the synthesized nanocatalyst powders, 0.5 g of each produced nanocatalysts (ZSM-5, ZSM-5/Fe, ZSM-5/Ni, ZSM-5/Fe/Ni) was poured into a test tube and, 10 mL of ethanol was added. The graphite electrode was inserted into the test tube and placed in an ultrasonic bath for 20 min. Then, the resulting electrode was rinsed twice with deionized water and placed in a furnace at a temperature of 300°C for 2 h.
MFC construction and operation
This study applied a separate two-part cell with an anaerobic anode and aerobic cathode. The chambers were 500 mL pyrex glass with 75% of the volume as a working volume (375 ml). The two chambers were separated by a pyrex tube with an inner diameter of 0.8 cm and a length of 13.4 cm embedded in the middle portion with the proton exchange Nafion 117 membrane. The electrodes were made of rod graphite and heated at 3000 °C with an area of 22.62 cm2. To remove any impurities and improve membrane performance, the membrane was first boiled for an hour in 3% H2O2 and then washed in 1 M sulfuric acid for 1 hour.
Oxygen gas was injected into the cathode with a sparger at a 20 mL/min flow rate, and nitrogen gas was injected into the anode chamber to provide anaerobic conditions. A magnetic stirrer was used to stir the solutions inside the anode and cathode chambers, and a copper wire was used to bond the anode and the cathode electrodes. Acidification of the medium inhibits the optimal growth of the bacteria in the anode chamber, so it is necessary to use a buffer with appropriate pH in the bacterial growth medium. For this purpose, to maintain the acid strength in the cell, 50 mM of phosphate-buffered solution (PBS) (0.13 g/L of potassium chloride, 3.32 g/L of sodium di-hydrogen phosphate dihydrate, 5.13 g/L of di-sodium hydrogen phosphate dihydrate, and 0.31 g/L of ammonium chloride) was prepared in the cathode chamber, and 375 mL was poured into the cathode chamber [37].
Microorganisms
In the anodic chamber of the fuel cell, the anaerobic wastewater prepared from the industrial town treatment plant was used as inoculum. The samples from the treatment plant were stored in stainless steel containers at 4 °C, and transferred to the laboratory. The combined inoculum was inoculated into the pre-prepared culture medium containing 1 g/L of glucose, 3 g/L of yeast extract, 11 g/L of peptone, 0.5 g/L of ammonium chloride [38]. During the experiments, the cells were kept at room temperature and stirred at 50 rpm for 72 h.
Analytical method
A multimeter (MASTECH MS8360G, China) was used to measure the cell's output voltage. The residual COD of the samples was measured with a COD meter (Model 76133, Aqua Litik, Germany). Three-electrode systems including, anode electrode (modified electrodes), platinum wire electrode, and silver/silver chloride electrode (as the working electrode), were used to electrochemically measure the made electrodes. Cyclic voltammetry (CV) and square wave voltammetry (Sqw) with a scanning rate of 5mV·s−1 in 50 mM phosphate-buffered solution (PBS) (Palmsense 3, the Netherlands) were used to investigate the electrochemical behaviors of the electrodes.
Results and Discussion
FT-IR Characterization
Investigation of FT-IR spectra of different zeolites (Figure.2) reveals two groups of vibrational peaks in these compounds. The first group is the peaks corresponding to the internal vibrations of SiO4 and AlO4 tetrahedral. These peaks are non-sensitive to the overall structure of the zeolite and are often found in all the zeolite structures. Partial degradation of the zeolite structure has little effect on the intensity of this group of peaks. The second group of peaks is only observed in some zeolite structures and is therefore attributed to inter-quadrupole connections. Due to the degradation of the zeolite structure, the intensity of this group of peaks decreases or disappears completely [39]. The characteristic peaks of the ZSM-5 zeolite are seen in the areas of 1080 cm-1 (internal asymmetric stretching vibration), 800cm-1 (external symmetric stretching), 547 cm-1 (double ring vibrations), and 450 cm-1 (SiO4 and AlO4 bending vibration). Figure 2 shows FT-IR spectral analysis and investigation of changes in the spectrum of ZSM-5 zeolite due to the deposition of Fe and Ni particles on it in the functionalized ZSM-5/Fe, ZSM-5/Ni, and ZSM-5/Fe/Ni nanocatalysts.
As shown in Figure 2, the deposition of Fe and Ni particles on the ZSM-5 zeolite caused partial translocation at the appearance site of the zeolite-related peaks. The broadening and intensity of the peaks related to regions of 450 to 797 increased in the spectra of ZSM-5/Fe, ZSM-5/Ni, and ZSM-5/Fe/Ni nanocatalysts. These changes can be attributed to the oxygen-metal vibrations in the mentioned area, which confirms the deposition of Fe and Ni particles on the zeolite surface. Since the peak at 1225 cm-1 indicates the nanoscale size of zeolite particles [40] and has not been eliminated in the catalyst synthesis process, it can be concluded that the structure and size of the zeolite particles did not change appreciably and retained their nanoscale dimensions.
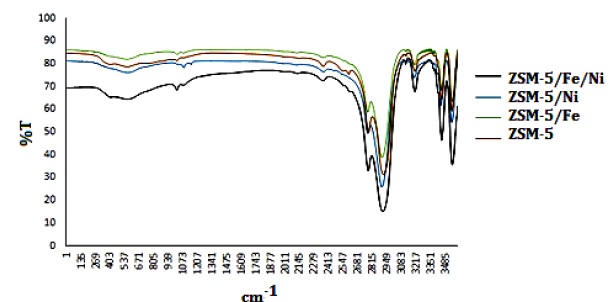
Figure 2: Fourier Transform-Infrared (FT-IR) Spectra of prepared nanocatalysts
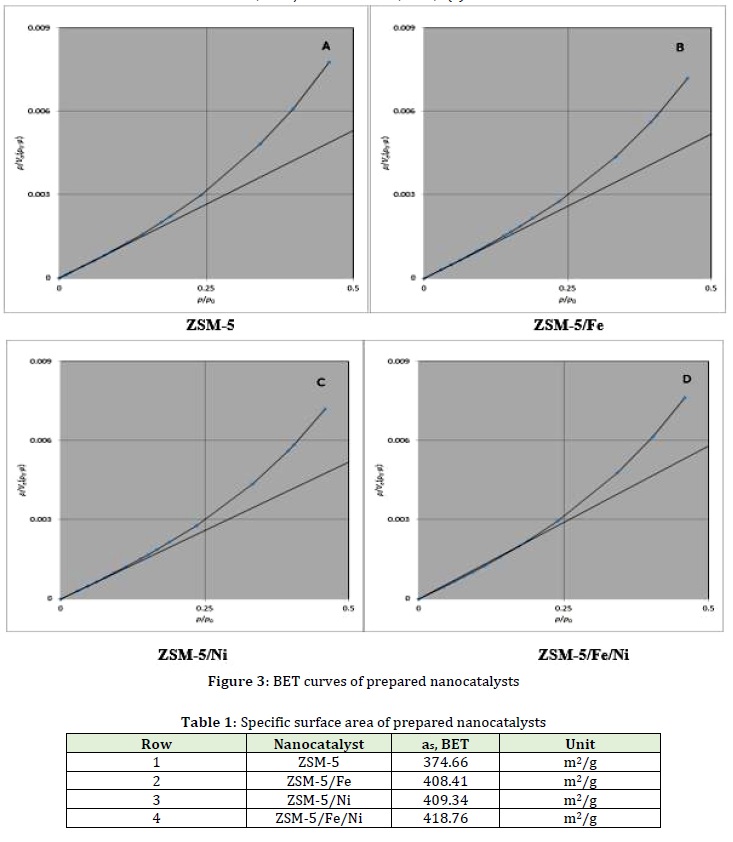
BET characterization
By comparing the BET parameter (Figure 3) and the results in Table 1, in each of the four BET analysis curves of the nanocatalysts, the highest SSA was related to the catalyst functionalized with both Fe and Ni metal (ZSM-5/Fe/Ni, which was determined to be 418.76 m2/g).
XRD and EDX Characterization
By comparing each of the curves in Figure 4 related to the XRD spectroscopy performed on the catalysts, the presence of Fe and Ni doped with hydrogen groups of aluminum silicate was determined in all four catalyst samples.
According to (a), (b), (c), and (d) in Figure 5 related to EDX spectroscopy taken from the surface of each of the G-Z, G-Z/Fe, G-Z/Ni, and G-Z/Fe/Ni electrodes, the peak at region 1 Kev belongs to carbon observed in all Figures. Figure 5 (a and b) is taken from the G-Z and G-Z/Fe electrode surface, respectively.
The peaks at 3, 6, 7 Kev are related to Fe particles and silicates adsorbed on the graphite electrode surface. Figure 5(c) demonstrates the presence of Ni particles in the ZSM-5 nanocatalyst structure on the graphite electrode surface at the 2Kev peaks, which indicates the presence of aluminosilicates. In Figure 5 (d), the peaks of 1,2, and 3 Kev show the co-existence of Fe and Ni particles in the ZSM-5 structure on the graphite electrode surface.

Figure 4: X-ray diffraction (XRD) spectroscopy of prepared nanocatalysts
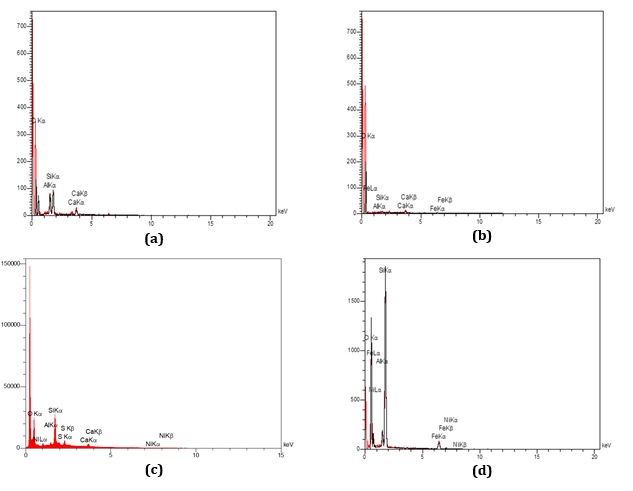
Figure 5: Energy-dispersive X-ray spectroscopy (EDX) analysis of the surface modified electrodes (a) G-Z; (b) G-Z/Fe; (c) G-Z/Ni; (d) G-Z/Fe/Ni
Electrochemical Characterization
According to Figure 6, the-cyclic-voltammetry (CV) analysis curves, each of the electrodes studied has a pair of ascending and descending peaks in the range of 0.42 to -0.7 so that the forward (ascending) peaks are related to the oxidation reaction, and the backward (descending) peaks are related to the reduction of the oxidation/reduction reactions. By comparing the curves, the peak of graphite electrode surface modified with nanocatalyst doped with both Fe and Ni metal (ZSM-5/Fe/Ni) has the highest current (148.4 μA) compared to other electrodes, probably due to the high SSA (418/76 m2/g), high electrical conductivity and active electrochemical sites of this electrode.
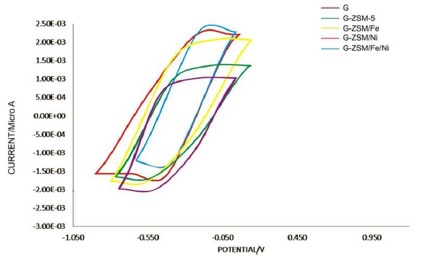
Figure 6: Cyclic voltammetry (CV) analysis of electrodes prepared in 50 mM phosphate-buffered solution (PBS) and room temperature
Figure 7 shows a curve related to the comparison of square wave voltammetry (Sqw) peaks of G, G-Z-5, G-Z-5/Fe, G-Z-5/Ni, and G-Z-5/Fe/Ni electrodes with a scanning rate of 5mV•s−1 in 50 mM (PBS) at the room temperature and in the potential range of 1 to 90 volts. By comparing the peaks of the electrodes, the peak of the G-Z/Fe/Ni electrode has the highest current (3500 μA/cm2) than the other electrodes. The peak from the graphite electrode (G) has the lowest current (2000 μA/cm2), indicating that the metal-doped ZSM-5 nanocatalyst improves the current in this analysis, G-Z/Ni peak has a higher current rate than the G-Z/Fe peak.

Figure 7: Square wave voltammetry (Sqw) analysis of electrodes prepared in 50 mM phosphate-buffered solution (PBS) and room temperature
According to the fuel cell steering committee over 72 h, the current production rate, as well as the chemical oxygen demand (COD) removal efficiency of MFC in this study, were expressed as curves in Figure (8) and (9) during this period with all five electrodes studied. By examining the curves in Figure (8) and (9) related to the graphite electrode surface modified with ZSM-5/Fe/Ni nanocatalyst, the maximum production current rate and chemical oxygen demand (COD) removal efficiency of the fuel cell steering committee were determined, such as electrochemical analyzes (CV and Sqw-voltammetry). The following investigated the MFC chamber's optimum temperature, time, and stirring rate conditions prepared with this electrode.
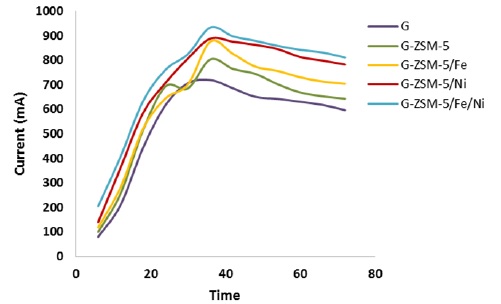
Figure 8: Cell current output in time
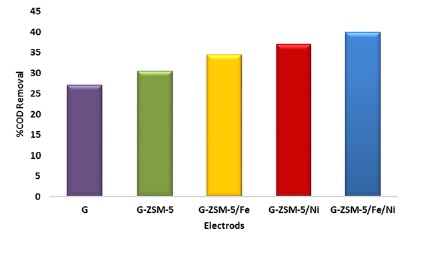
Figure 9: chemical oxygen demand (COD) removal efficiency
Optimization and Experimental Design
This study used RSM experimental design in combination with the Central Composite Design (CCD) method to investigate the effects of influencing variables, including retention time (A), cell chamber temperature (B), stirring rate (C), current production rate (I) and chemical oxygen demand (COD) removal efficiency. Due to the extensive research in temperature, retention time, and stirring rate in MFC reactors, these parameters have been used as influencing factors in cell optimization in this study [41-48].
The RSM method is a mathematical and statistical method used for the analysis and empirical modeling of problems where several variables and the RSM influence a given answer can be calculated to determine the optimal conditions. One advantage of this method is to reduce the number of empirical tests performed to obtain statistically valid results. In addition, the RSM method can also analyze the interactions between variables. Therefore, this optimization method can report more comprehensive and accurate data by performing a few experiments [49-50]. Table 2 reveals the range of independent variables and design levels of the experiments examined in this study.
The results of the complete design of the test and the exact responses of the tests used are also listed in Table 3.
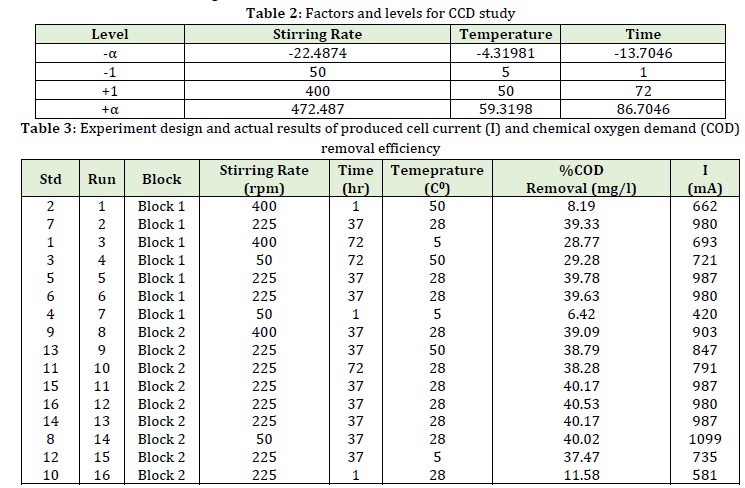
According to the above-mentioned tables (2 and 3), the purpose of this study was to determine the optimum values of retention time, temperature, and stirring rate for maximum utilization of the cell.

According to the results of the data analysis in Table 4, a quadratic function model can fit well to the empirical results. The fit of this model was evaluated by Analysis of Variance (ANOVA), normal probability plot, and residual analysis. The quadratic function for chemical oxygen demand (COD) removal efficiency is expressed as follows:
COD = 40.14 – (0.46 ×A) + (13.35×B) + (0.66×C) + (0.090×A×B) + (2.49×A×C) – (0.78×B×C) – (1.67× A2) – (16.29 × B2) – (3.09× C2)
In Table 4, the ANOVA analysis showed the importance of each parameter in response to produced cell current (I) and chemical oxygen demand (COD) removal efficiency by P and F values. The smaller the P-value, the higher its impact factor and contribution to the response variable. The P values less than 0.05 indicate that the model expressions are significant. The P-values of more than 0.1 indicates that the model terms are insignificant. Accordingly, the seven terms of (A), (B), (C), (BC), (A2), (B2), and (C2) are significant parameters of the model and have the most excellent effect on produced cell current (I) and chemical oxygen demand (COD) removal efficiency. The P values of the other terms were more significant than 0.05, which means that their effect on the response model was not statistically significant. Figure 10 shows the residual curve in the predicted response for both produced cell current (I) and chemical oxygen demand (COD) removal efficiency. This Figure shows that all empirical data are uniformly distributed around the mean response variable. This indicates that the proposed model is sufficient, and there has been no deviation from the hypotheses made.
As shown in Table 5, the difference between the adjusted R2 and the predicted R2 is less than 0.2, and the precision of the model is 63.067 (which is greater than 4), indicating the used model is accurate.
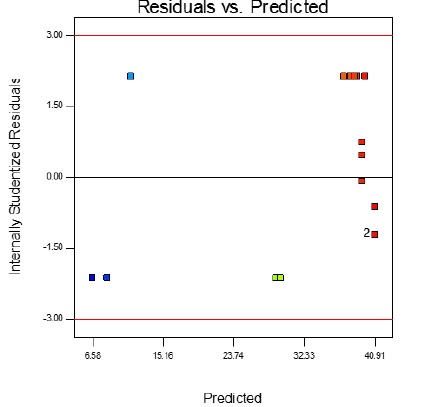
Figure 10: The residual value curve in terms of the predicted response
Figure 11 compares the actual response values obtained from the empirical results and the predicted response values from the quadratic function model equation. It is observed that the model describes the empirical results and data fairly accurately, meaning that it has been successful in comparing the correlations between the three variables. In addition, there is a sufficient correlation with the linear regression coinciding with the R-value of about 0.9966.
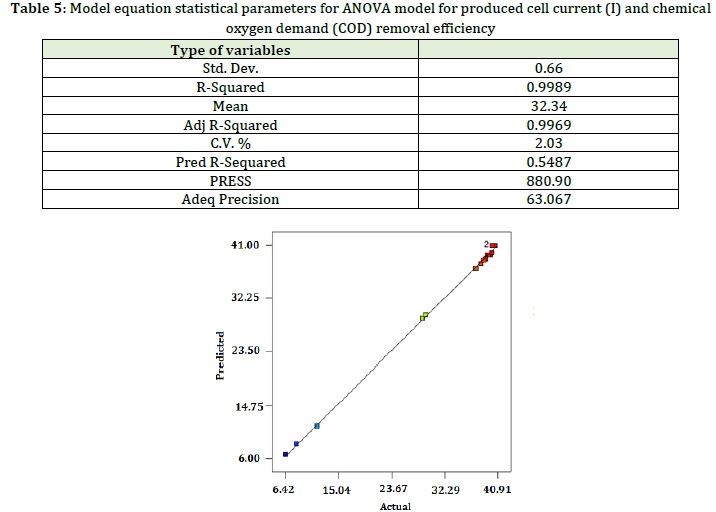
Figure 11: Comparison between predicted and actual empirical values of produced cell current (I) and chemical oxygen demand (COD) removal efficiency
Figure 12 shows the 3D curves of the interaction of temperature, retention time, and stirring rate parameters for production current rate (I) and COD removal efficiency. The highest COD efficiency and production current rate were reported at about 28°C, 37 h, and 50 rpm.
It should be noted that Figure.12 (a) and (b) show a similar trend. According to Figure 12 (a), it can be seen that at high values of stirring rate, the COD removal efficiency increases with increasing temperature. However, at high values of stirring rate, the COD removal efficiency increases with increasing temperature. This indicates that when the stirring rate is high, the system needs a higher temperature to increase COD removal efficiency. Figure 12 (c) and (f) also reveal a similar trend. This indicates that the interaction between temperature (A) and stirring rate (C), retention time (B), and stirring rate (C) on the produced cell current is high than the interaction between temperature (B) and retention time (A) (Figure 12 (c)).
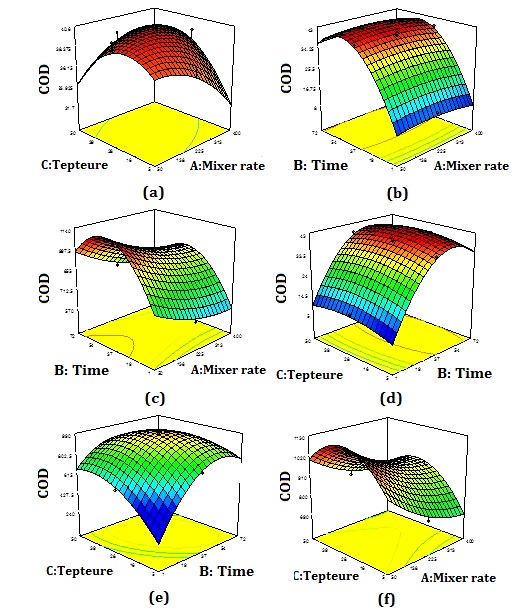
Figure 12: 3D response surface method curves of chemical oxygen demand (COD) removal efficiency and produced cell current (I)
Conclusion
In this study, a microbial fuel cell was made based on graphite anode electrodes modified with ZSM-5, ZSM-5/Fe, ZSM-5/Ni, and ZSM-5/Fe/Ni nanocatalysts. The presence of iron and nickel in the structure of nano-catalysts was confirmed by FTIR analysis and by increasing their specific surface area by BET analysis. The surface modification of the graphite electrode was confirmed by the aforementioned nanocatalysts by EDX and XRD analysis. According to the results of cyclic voltammetry (CV) and square wave (Sqw) analysis and experimental results of the cell guidance in this study, the electrode (G-Z/Ni/Fe) has maximum output current efficiency and maximum chemical oxygen demand removal efficiency (933.8 mA, 40.02%) compared to other electrodes (G-Z/Ni,G-Z/Fe,G-Z,G) investigated in this study. The increased cell efficiency with the modified electrode is due to the high specific surface area (418.76 m2/g) for microbial growth and high electrical conductivity (improved electron transfer) of the nanocatalyst compared to other electrodes. The presence of nickel (electrical conductivity: 1.4×10⁷) and iron (electrical conductivity:1×10⁷) increased the electrode conductivity. According to the results of Surface Response Method (RSM), optimum temperature, retention time and stirring rate for maximum output current (1099 mA) and maximum chemical oxygen demand removal efficiency (COD%) (40.53%) The electrode (G-Z/Ni/Fe) was determined at 28 °C, 37 h and 50 rpm, respectively. Therefore, the electrode (G-Z/Ni/Fe) can be introduced as a promising electrode to increase the efficiency of microbial fuel cells with an economic approach.
Acknowledgments
The authors would like to appreciate Mr. Mojtaba Azemi Motlagh, Laboratory Technical Manager of Arman Shimi Palayesh Gostar Company, a Mr. Hoshang Asadi, Personnel of Chemistry Laboratory at Islamic Azad University, South Tehran Branch, for providing laboratory facilities and equipment.
Funding
This research did not receive any specific grant from fundig agencies in the public, commercial, or not-for-profit sectors.
Authors' contributions
All authors contributed toward data analysis, drafting and revising the paper and agreed to responsible for all the aspects of this work.
Conflict of Interest
We have no conflicts of interest to disclose.
ORCID
Mostafa Hassani:
https://orcid.org/0000-0002-8138-3239
Mohsen Zeeb:
https://orcid.org/0000-0002-6116-7395
Amirhossein Monzavi:
https://orcid.org/0000-0003-1880-6056
Zahra Khodadadi:
https://orcid.org/0000-0002-6965-5123
Mohammad Reza Kalaee:
https://orcid.org/0000-0003-2396-7006
HOW TO CITE THIS ARTICLE
Mostafa Hassani, Mohsen Zeeb, Amirhossein Monzavi, Zahra Khodadadi, Mohammad Reza Kalaee, Response Surface Modeling and Optimization of Microbial Fuel Cells with Surface-Modified Graphite Anode Electrode by ZSM-5 Nanocatalyst Functionalized. Chem. Methodol., 2022, 6(3) 253-268
DOI: 10.22034/CHEMM.2022.324312.1425
- Min B., Cheng S., Logan B.E., Water Res., 2005, 39:1675 [Crossref], [Google Scholar], [Publisher]
- Li W.W., Yu H.Q., He Z., Energy Environ. Sci., 2014, 911:7 [Crossref], [Google Scholar], [Publisher]
- Schievano A., Sciarria T.P., Gao Y.C., Scaglia B., Salati S., Zanardo M., Waste Manag., 2016, 519:29 [Crossref], [Google Scholar], [Publisher]
- Jiang Y., Su M., Zhang Y., Zhan G., Tao Y., Li D., J. Hydrog. Energy, 2013, 3497:38 [Crossref], [Google Scholar], [Publisher]
- Xie X., Criddle C., Cui Y., Energy Environ. Sci.,, 2015, 8:3418 [Crossref], [Google Scholar], [Publisher]
- Clarke T.A., Edwards M.J., Gates A.J., Hall A., White G.F., Bradley J., Reardon C.L., Shi, L., Beliaev A.S., Marshall M.J., Wang Z., Watmough N.J., Fredrickson J.K., Zachara J.M., Butt J.N., Richardson D.J., Nat. Acad. Sci., 2011, 108:9384 [Crossref], [Google Scholar], [Publisher]
- Cornejo J.A., Sheng H., Edri E., Ajo-Franklin M.C., Frei H., Comm., 2018, 9:2263 [Crossref], [Google Scholar], [Publisher]
- Kalathil S., Patil S., Pant D., Encyclopedia of Interfacial Chemistry, 2017, 309 [Crossref], [Google Scholar], [Publisher]
- Kumar G., Kirubaharan C.J., Yoo D.J., Kim A.R., J. Hydrog. Energy, 2016, 41:13208 [Crossref], [Google Scholar], [Publisher]
- Mishra P., Jain R., J. Hydrog. Energy, 2016, 41:22394 [Crossref], [Google Scholar], [Publisher]
- Hou Y., Yuan H., Wen Z., Cui S., Guo X., He Z., Chen J., Power Sources, 2016, 307:561 [Crossref], [Google Scholar], [Publisher]
- Manickam S.S., Karra U., Huang L.W., Bui N.N., Li B.K., McCutcheon J.R., Carbon, 2013, 53:19 [Crossref], [Google Scholar], [Publisher]
- Liu J., Qiao Y., Guo C.X., Lim S., Song H., Li C.M., Technol., 2012, 114:275 [Crossref], [Google Scholar], [Publisher]
- Yellappaa M., Sravan J.S., Sarkar O., Rami Reddy Y.V., Venkata Mohan S., Technol., 2019, 284:148 [Crossref], [Google Scholar], [Publisher]
- Xu H., Wang L., Wen Q., Chen Y., Qi L., Huang J., Tang Z., Bioelectrochemistry, 2019, 129:144 [Crossref], [Google Scholar], [Publisher]
- Zhaia D.D., Fanga Z., Jin H., Hui M., Kirubaharan C.J., Yu Y.Y., Yong Y.C., Technol., 2019, 288:121499 [Crossref], [Google Scholar], [Publisher]
- Yin T., Zhang H., Yang G., Wang L., Met., 2019, 252:8 [Crossref], [Google Scholar], [Publisher]
- Li Z.I., Yang S.K., Xu H.Y., Wang Z.Z., Wang W.K., Dang Z., Zhao Y., J. Hydroh. Energy, 2019, 44:6862 [Crossref], [Google Scholar], [Publisher]
- Tian T., Qiao S., Yu C., Yang Y., Zhou J., Chemosphere, 2019, 218:119 [Crossref], [Google Scholar], [Publisher]
- Zeng L., Zhao S., He M., Power Sources, 2018, 376:33 [Crossref], [Google Scholar], [Publisher]
- Jiaa X., He Z., Zhang X., Tian X., Met., 2016, 215:170 [Crossref], [Google Scholar], [Publisher]
- Chang S.H., Liou J.S., Liu J.L., Chiu Y.F., Xu C.H., Chen B.Y., Chen J.Z., Power Sources, 2016, 336:99 [Crossref], [Google Scholar], [Publisher]
- Kalathil S., Pant D., RSC Adv., 2016, 6:30582 [Crossref], [Google Scholar], [Publisher]
- Chaudhuri S.K., Lovley D.R., Biotechnol., 2003, 21:1229 [Crossref], [Google Scholar], [Publisher]
- Logan B., Cheng S., Watson V., Estadt G., Sci. Technol., 2007, 41:3341 [Crossref], [Google Scholar], [Publisher]
- Gao X., Zhang Y., Li X., Ye J., Lett., 2013, 105:24 [Crossref], [Google Scholar], [Publisher]
- Emori E.Y., Hirashima F.H., Zandonai C.H., Ortiz-Bravo C.A., Fernandes-Machado N.R., Olsen-Scaliante M.H.N., Today, 2017, 279:168 [Crossref], [Google Scholar], [Publisher]
- Zhang Q., Liu G., Wang L., Zhang X., Li G., Energy Fuels, 2014, 28:4431 [Crossref], [Google Scholar], [Publisher]
- Li W., Li G., Jin C., Liu X., Wang J., Mater. Chem. A, 2015, 3:14786 [Crossref], [Google Scholar], [Publisher]
- Aelterman P., Versichele M., Genettello E., Verbekenb K., Verstraetea W., Acta, 2009, 54:5754 [Crossref], [Google Scholar], [Publisher]
- Zhao F., Harnisch F., chroder U., Scholz F., Bogdanoff P., Herrmann I., Commun., 2005, 7:1405 [Crossref], [Google Scholar], [Publisher]
- Ji J.Y., Jia Y.J., Wu W.G., Bai L.L., Ge L.Q., Gu Z., Colloids Surf. A Physicochem. Eng. Asp., 2011, 390:56 [Crossref], [Google Scholar], [Publisher]
- Peng X., Yu H., Wang X., Geng L., Ai L., Power Sources, 2013, 223:94 [Crossref], [Google Scholar], [Publisher]
- Peng X.H., Yu H.B., Wang X., Zhou Q.X., Zhang S.J., Geng L.J., Sun J.W., Cai Z., Technol., 2012, 121:450 [Crossref], [Google Scholar], [Publisher]
- Wang H., Wang G., Ling Y., Qian F., Song Y., Lu X., Chen S., Tong Y., Li Y., Nanoscale, 2013, 21:10283 [Crossref], [Google Scholar], [Publisher]
- Valipour A., Ayyaru S., Ahn Y., Power Sources, 2016, 327:548 [Crossref], [Google Scholar], [Publisher]
- Wena Q., Wua Y., Cao D., Zhao L., Sun Q., Tech., 2009, 100:4171 [Crossref], [Google Scholar], [Publisher]
- Fatemi S., Ghoreyshi A.A., Najafpour Gh., Rahimnejd M., J. Biol, 2013, 27:546 In Persian [Publisher]
- Cejka J., Introduction to zeolite science and practice, Elsevier, 2007 [Google Scholar]
- Cheng Y., Wang L.J., Li J.S., Letter., 2005, 59:3427 [Crossref], [Google Scholar], [Publisher]
- McKeown R.M., Scully C., Mahony T., Collins G., O'Flaherty V., Water Res., 2009, 43:1611 [Crossref], [Google Scholar], [Publisher]
- Scully C., Collins G., O'Flaherty V., Water Res., 2006, 40:3737 [Crossref], [Google Scholar], [Publisher]
- Lopez J., Monsalvo V.M., Puyol D., Mohedano A.F., Rodriguez J.J., Technol., 2013, 140:349 [Crossref], [Google Scholar], [Publisher]
- Bandara W.M., Satoh H., Sasakawa M., Nakahara Y., Takahashi M., Okabe S., Water Res., 2011, 45:3533 [Crossref], [Google Scholar], [Publisher]
- Stams A.J.M., Plugge C.M., Rev. Microbiol., 2009, 7:568 [Crossref], [Google Scholar], [Publisher]
- Tian T., Qiao S., Yu C., Yang Y., Zhou J., Chemosphere, 2019, 218:119 [Crossref], [Google Scholar], [Publisher]
- Glissmann K., Chin K.J., Casper P., Conrad R., Ecol., 2004, 48:389 [Crossref], [Google Scholar], [Publisher]
- Tkach O., Sangeetha T., Maria S., Wang A., J. Environ. Sci., 2017, 52:284 [Crossref], [Google Scholar], [Publisher]
- Chieng B.W., Ibrahim N.A., Wan Yunus W.M.Z., Plast. Technol. Eng., 2012, 51:791 [Crossref], [Google Scholar], [Publisher]
- Zhang B., Zhang J., Yang Q., Feng C., Zhu Y., Ye Z., Ni J., Technol., 2012, 124:1 [Crossref], [Google Scholar], [Publisher]
)