Document Type : Original Article
Authors
Department of Chemical Engineering, Islamic Azad University, Mahshahr, Iran
Abstract
In this study, the citric acid-assisted sol-gel method was used for perovskite MoTiO3/GO nanocomposites preparation. The prepared samples were characterized by SEM, BET, FT-IR, and XRD analysis. The photocatalytic activity of MoTiO3/GO was evaluated by converting CO2 under visible light irradiation to methanol. Results indicated that MoTiO3/GO (1.5wt.%) exhibited significant methanol production up to 303.7 µmol g cat-1 after visible light irradiation lasting for 4 hr. Therefore, it can be said that MoTiO3 / GO is a suitable candidate for the efficient conversion of CO2 to methanol.
Graphical Abstract
)
Keywords
Main Subjects
Introduction
Emissions of greenhouse gases are one of the main causes of ozone depletion, which is a serious threat [1]. Global energy demand is inevitable and is forecasted to increase in the coming years [2]. Unfortunately, carbon dioxide emission from high fossil fuel consumption is the main cause of global warming. Therefore, one way to deal with this problem is to release CO2 capturing. However, the techniques of carbon capture and storage are highly uneconomical for medium and small plants, which is a major drawback [3]. The photocatalytic conversion of CO2 to hydrocarbons by utilization of solar light is one way to overcome environmental and energy problems [4].
Nowadays, various kinds of methods, including chemical conversion [5], electrochemical reduction [6-8], photocatalytic reduction [9], photoelectrochemical reduction [10] etc., have been utilized for CO2 conversion to methanol. Amongst these processes, photocatalytic reduction is more considered [11]. There are several catalytic/ photocatalytic materials that have been utilized for the conversion of CO2 into valuable products. However, most of the photocatalysts studied are inefficient in activity/stability, and the maximum conversion efficiency of CO2 is still far from the required efficiency for practical applications [12, 13]. So, developing new with high-potential photocatalyst materials is still an essential issue. The transport of the photogenerated carriers (e− and H+) is critically governed by the particle size of the photocatalyst, crystallinity, surface properties, and structural defects [14]. Therefore, the preparation of particles with the small and uniform sizes is one key issue and it is highly desirable to develop economical, and facile synthetic routes to prepare semiconductor photocatalysts that offer control of particle size, crystallinity, morphology, and structural defects of photocatalysts at nanometer scale, thus enabling one to exercise control over the photoactivity of the material [15, 16].
Among the photocatalysts, a variety of semiconductors based on niobates, tanatalates, and titanates, such as InTaO4, NaTaO3, Bi2Ti2O7, and La2Ti2O7 have been extensively studied [17]. A common structural feature of all these photocatalysts is the presence of [BO6] (B = Ti, In, Nb, Ta, etc.) octahedral moiety, which are considered to be active motifs for reaction [18]. The MOTiO3 is composed of the octahedral [TiO6] and [MoO6], containing both early-transition metal (d0) and p-block metal (d10), where the [MoO6] octahedra in the crystal structure are considered to favor the mobility of charge carriers and elevate the photocatalytic activity.
So far, mixing with metal oxides has been considered to increase photocatalytic activity of photocatalysts [19]. Graphene oxide (GO) is a substance that, when coupled with metal oxides, can improve its photocatalytic activity. It is well known that the two-dimensional layered structure graphene has extraordinarily high electrical conductivity, unique mechanical properties, an ultrahigh specific surface area, etc. [20]. In GO structure, the electrons freed after the titanium dioxide activation are easily transported to the graphene structure, and recombination of e- and h+ is strongly reduced, which increases the process yield. To explore and improve the electrochemical performance of transition metal oxide, the general method is combining it with carbon materials such as graphene [21].
In this study, the novel perovskite MoTiO3/GO nanocomposite has been successfully prepared and introduced. Also, the perovskite MoTiO3/GO nanocomposite is characterized by scanning electron microscopy, FT-IR, Brunauer Emmett Teller (BET), and XRD analysis. In the following, the photocatalytic activities of MoTiO3/GO nanocomposite were tested on CO2 conversion to methanol.
Materials and Methods
(NH4)6Mo7O24·4H2O, Ti(NO3)4, (NH4)2CO3, KOH, C₁₂H₂₅NaO₄S, and HNO3 were purchased from Merck Co Ltd. Citric acid and GO were purchased from Sigma-Aldrich Ltd. DI water was obtained by a purification system (Millipore).
Pre-treatment of GO
The pretreatment of GO was carried out as follows:
At first, typically, 3 g GO was refluxed in 150 mL of 2 M KOH solution containing 1 wt.% sodium dodecyl sulfate (C₁₂H₂₅NaO₄S) at 120 °C for 2 h, then the mixture was cooled to room temperature, rinsed with DI water, and filtered through a 0.2 µm pore-sized filter membrane. The treatment was followed by concentrated nitric acid (65 wt.%), so that the sample was refluxed in concentrated nitric acid (65 wt.%) for 24 h with continuous stirring. The final product on the membrane was washed thoroughly with DI water and dried at room temperature.
Preparation of MoTiO3-GO nanocomposite
The preparation of MoTiO3/GO was carried out by the sol-gel citrate method. The precursors used in preparation of MoTiO3 perovskite were nitrate and ammonium oxide of respective elements Ti(NO3)4 and (NH4)6Mo7O24·4H2O because of their high solubility in water and homogeneity. Citric acid was used as a sol-gel agent and 1 M (NH4)2CO3 was used to adjust pH. At first, equimolar amounts of Titanium Nitrate and Ammonium heptamolybdate tetrahydrate were added to deionized water. After that, citric acid was added as a sol-gel agent and (NH4)2CO3 (1M) was used to adjust the pH to 6. After stirring for 10 min, 1.5 g of GO (at different concentrations of 0.5, 1, 1.5 and 2 wt%) was added and stirred until the temperature was raised to 60 °C and left to evaporate to obtain sol-gel. By the decomposition of nitrate ions due to the release of violent NOx gas, the gel was formed. The resultant gel was then dried in an oven at 100 °C under a vacuum for 2 h. Then, the final product was calcined at 1000 °C for 5 h with a heating rate of 5 °C/min.
Characterization
Scanning electron microscopy (SEM) and the BET techniques were used for the structural study of the samples by JEOL USA JSM-7610FPlus SEM and Micrometrics, ASAP 2020 analyzer, respectively. Crystallography of samples was performed by XRD X’Pert Philips device. Fourier transform infrared spectra (FT-IR) was employed by the Thermo Scientific™ Nicolet™ iS20 FTIR Spectrometer to identify the functional groups of samples. The structure of samples was analyzed by using the Thermo Scientific™ DXR™3 Smart Raman spectrometer. Spectroscopy analysis (UV–Vis) was carried out using JASCO UV/VIS spectrophotometer (Model 770) using a 10 mm quartz cell. Elemental analysis of synthesized nanocomposite was done by an Energy-dispersive X-ray spectroscopy (EDX) detector (EDX-7200, Shimadzu, Japan).
Photocatalytic reduction of CO2
The experiment of CO2 conversion was done in a continuous gas flow reactor at room temperature. The catalysts were placed in t middle of a 500 ml quartz tube reactor with an inner diameter of 10 mm. A medium pressure mercury (254 nm, 9W) and xenon (65 W) lamps were used as a UVC-visible light/ irradiation source. The catalyst powder was loaded into the reactor. At first, to evacuate the reactor from the air, nitrogen gas was injected. Then, the CO2 continuously flowed inside the reactor with a flow rate of 8 sccm. Afterward, the photoreaction started as soon as the lamps were switched on. The methanol content was measured using the gas chromatography–mass spectrometry (GC–MS) (Trace GC Ultra-ITQ1100 (Thermo-Fisher)) in the vapor phase.
Results and Discussion
SEM micrograph is used to investigate the surface morphology and the general morphological features of the prepared composites nanomaterials. As can be seen in Figure 1, the surface of the MoTiO3 reveals a spongy discrete particle appearance. Also, it is evident that the GO has a folded layer surface. In the case of MOTiO3/GO, spherical particles were observed with the placement of a flake-like shape of graphene oxide in the structure. In addition, a porous structure with large voids can be seen. The formation of these features is attributed to the release of a large amount of gas during the gel preparation.
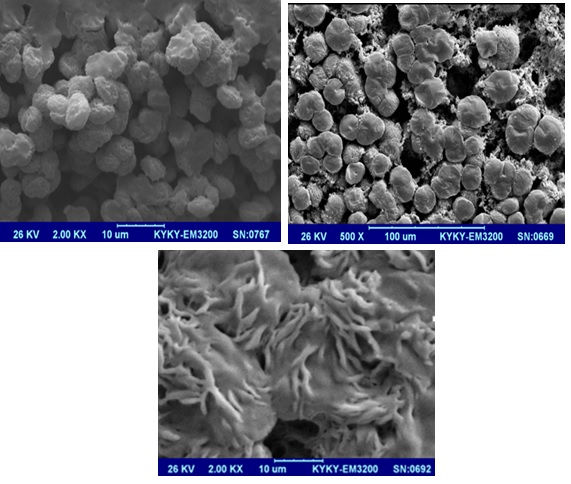
Figure 1: SEM micrographs of (A) MoTiO3, (B) GO, (C) MoTiO3/GO (1.5 wt.%)
The BET method was used to assess the surface area pore size distribution of GO, MoTiO3 and MoTiO3/GO. The Nitrogen adsorption-desorption isotherm curves for GO and MoTiO3/GO exhibit IV type with a H3 hysteresis loops, characteristics of mesoporous structure (Figure 2). For MoTiO3, the hysteresis loop is not visible, indicating its small surface area.
The average pore size distributions of samples are shown in Figure 3. As can be seen, The GO average pore size is around 3-4 nm. Also, the MoTiO3 illustrated a wide pore size distribution around 23 nm. It is remarkable to note that the pore size distribution of MoTiO3/GO does not make much difference with that of MoTiO3. It might be due to the MoTiO3 surface coating on the GO surface.
The specific surface area of prepared samples is also systematically shown in Table 1. As can be seen, specific surface area of integrated photocatalyst increased with increasing GO content to 1.5 wt.% and then decreased by further increasing up to 2 wt.%.
The relatively small surface area was achieved for MoTiO3, which is due to the particles coalesce. On the other hand, the large crystallite size is also effective in reducing the surface area. The MoTiO3/GO samples had a higher specific surface area than MoTiO3 due to the uniform distribution of MoTiO3 on GO. However, GO content increasing more than 1.5 wt.% leads to a decrease in the specific surface area as the GO agglomeration.

Figure 2: Nitrogen adsorption-desorption isotherms of a) GO, b) MoTiO3/GO, and c) MoTiO3

Figure 3: Pore size distribution of GO, MoTiO3, and MoTiO3/ (GO,1.5 wt.%)
Table 1: The total surface area of prepared samples measured by BET method
|
Samples |
Total surface area (m2g-1) |
|
MoTiO3/GO (0 wt.% MoTiO3) |
35.1 |
|
MoTiO3/GO (0 wt.% GO) |
7.8 |
|
MoTiO3/GO (0.5 wt.% GO) |
15.3 |
|
MoTiO3/GO (1 wt.% GO) |
25.3 |
|
MoTiO3/GO (1.5 wt.% GO) |
35.5 |
|
MoTiO3/GO (2 wt.% GO) |
23.2 |
The XRD pattern of samples is shown in Figure 4. In the XRD pattern of GO, characteristics of the (0 0 1) crystal plane of GO was visible at 10, corresponding to definite d-spacing of 0.83 nm. For the MoTiO3 sample at calcination temperature of 1000 °C, all diffraction peaks were referred to the perovskite phase with the tetragonal structure. The lattice parameters for MoTiO3 were calculated for tetragonal phase using the Rietveld refinement [19], embedded into the PowderCell 2.4 software. Consequently, the average crystallite size was estimated to be 24.4 nm in diameter. For the case of MoTiO3/GO, only the main diffraction peaks of GO and MoTiO3 were seen in XRD pattern.

Figure 4: XRD pattern of GO, MoTiO3, and MoTiO3/(GO,1.5 wt.%)
The FT-IR results of GO, MoTiO3, and MoTiO3/GO are shown in Figure 5. As evident from Fig. 5, the GO represents characteristic peaks at 1730 cm-1, 1230 cm-1, 1040 cm-1 and 3435 cm-1 related to the C=O, C-OH, C-O, O-H stretching vibrations, respectively. Also, the skeletal vibration of unoxidized graphitic domains was seen at 1620 cm-1.
For the MoTiO3, absorption peaks at 3387 cm−1 and 1619 cm−1 were assigned to the hydroxyl vibration. It is speculated that the hydroxyl group was derived from the adsorption water on the sample's surface. Also, the adsorption peak at 549 cm−1 appeared in MoTiO3, which was attributed to the characteristic stretching vibration of the Mo-Ti-O bond in the perovskite compounds. The carbonate ions were formed on the MoTiO3 surface due to the chemisorption of CO2 gases in the ambient atmosphere. So, the appeared peaks at 1485 and 1384 cm−1 were related to the splitting of the asymmetric stretching of these ions.
In the integrated photocatalyst FT-IR spectra, it is clear that some of the stretching vibration bands had shifted to a lower frequency. This was most likely due to a chemical interaction between the MoTiO3, and GO.

Figure 5: FT-IR spectra of GO, MoTiO3 and MoTiO3/ (GO,1.5 wt.%)
Furthermore, to confirm the formation of the MOTiO3/GO nanocomposites, Raman spectroscopy was done. As shown in Figure 6, the characteristic peaks located at 1310, and 1512 cm-1 are due to the D-band (originating from disordered carbon) and G-band (deriving from graphitic carbon), respectively. Also, MOTiO3 possesses the Raman scattering from 100 to 400 cm−1 that leads to continuous broadband. The MOTiO3 shows its characteristics peaks at 101, 298, 372, 654, 751, and 1011 cm−1. The extra two bands have been obtained at 1393 (D band) and 1596 cm−1 (G band) for the MOTiO3/GO, which confirms the existence of GO.
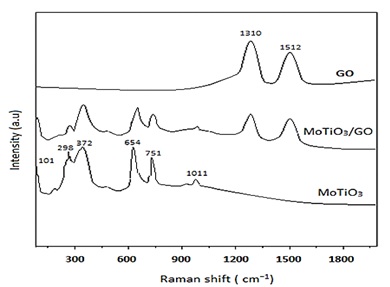
Figure 6: Raman spectra of GO, MoTiO3 and MoTiO3/GO
The UV visible spectra of GO, MoTiO3, and MoTiO3/GO are shown in Figure 7. According to the obtained data, the absorption edge of MoTiO3 is 375 nm. After combination, the absorption edge of MoTiO3 shifted to an extended wavelength (553 nm) in the visible region. Also, the absorption intensity increased due to an interaction between MoTiO3 and GO due to the absorption edge of GO (264 nm). According to Eg= 1240/𝛌g, the optical gap band of the MoTiO3 and MoTiO3/GO were obtained by 3.3 eV and 2.24 eV. Generally, by introducing GO in nanocomposite structure, the harvesting visible light energy was affected. So, an enhancement in full-light-driven photocatalytic activity was expected.
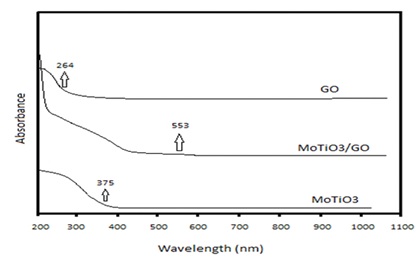
Figure 7: UV–Vis absorption spectra for GO, MoTiO3 and MoTiO3/GO
The elemental compositions of the MoTiO3/GO nanocomposite were identified by EDX analysis measurement as shown in Figure 8. The EDX results indicated the existence of C, O, Mo, and Ti elements without any impurity. The quantitative analysis of MoTiO3/GO is shown in Figure 8b. The weight percentage of C (25.41%), O (28.61%), Ti (19.36%), and Mo (26.62%) is presented.

Figure 8: The EDX analusis for [Co(L3)2 (H2O)2]Cl2
Conversion of CO2 into methanol using photocatalyst
The result of methanol production, (µmol g cat-1 h-1), is illustrated in Figure 9. The methanol production increased with irradiation time. It took 4 hours to maximize methanol production. After that, it slightly decreased with a long reaction time due to the further oxidation of produced methanol. It might be explained by that the hole in the valence band reacted with water to produce proton and OH−. The OH− could be transformed into the OH radicals, which could degrade produced methanol.
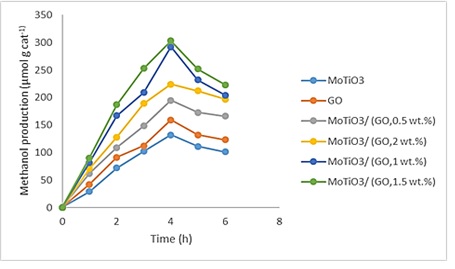
Figure 9: photocatalytic methanol production from CO2 over MoTiO3/GO integrated photocataly
The rate of methanol production on the catalysts was as follows: MoTiO3/ (GO,1.5 wt.%)> MoTiO3/ (GO,1 wt.%)> MoTiO3/ (GO,2 wt.%)> MoTiO3/(GO,0.5 wt.%) >GO > MoTiO3 . For MoTiO3/ (GO,1.5 wt.%), the largest yield of methanol was 303.7 µmol g cat-1. It is clear that the MoTiO3 photo reduction performance promotes by introducing of GO. It might be explained by that the conducting band of MoTiO3 was around 4.22 eV. So, the charge transfers from MoTiO3 to GO took place due to the work function of graphene oxide (around 4.42 eV). The excited state electrons that were transferred from MoTiO3 to graphene oxide by ultraviolet radiation could move freely along the graphene oxide conductor network and then moved to the surface to react with CO2. The average free path of the electrons on graphene oxide indicated that the energetic electrons covered a larger area of the GO surface, thus increasing the interaction with the adsorbed reactants. On the other hand, the high surface area of MoTiO3/GO provided more active sites for reactions. However, a further increasing of GO more than 1.5 wt.% led to a decrease in the specific surface area as the GO agglomeration. The high GO loading would cover the photoactive site on the MoTiO3 surface, subsequently reducing the photo exciting site, which caused less methanol production. The scattering and absorbance of photons by excess graphene increased, protecting the light from reaching the MoTiO3 photocatalyst surface.
Conclusion
This study successfully demonstrated the application of a new MoTiO3/GO integrated photocatalyst for the conversion of CO2 to methanol. The effect of GO content on MoTiO3/GO was investigated on the specific surface area of the nanocomposite. The results showed that the specific surface area of integrated photocatalyst increased with increasing GO content to 1.5 wt.% and then decreased by further increasing.
Since the specific surface area affected the conversion rate, nanocomposite with the GO concentration of 1.5 wt.% was evaluated as a feasible sample in subsequent sections. SEM result of MOTiO3/GO nanocomposite indicated the spherical particles of MOTiO3 with the placement of flake-like shape of graphene oxide in structure. Also, in the integrated photocatalyst FTIR spectra, some of the stretching vibration bands had shifted to a lower frequency. The XRD analysis of MoTiO3/GO showed the main diffraction peaks of GO and MoTiO3 in structure. For CO2 conversion to methanol, MoTiO3/GO (1.5wt.%) exhibited much higher methanol production capacity than MoTiO3. Throughout this study, the optimum ratio of 1.5 wt. % of GO deposited on MoTiO3 successfully yields 303.7 µmol g cat-1 of methanol for 4 hours. Integrated between MoTiO3 and GO could be seen as a potential combination for the conversion of CO2 to methanol in the future.
Funding
This research did not receive any specific grant from fundig agencies in the public, commercial, or not-for-profit sectors.
Authors' contributions
All authors contributed toward data analysis, drafting and revising the paper and agreed to responsible for all the aspects of this work.
Conflict of Interest
We have no conflicts of interest to disclose.
HOW TO CITE THIS ARTICLE
Siamak Shehni, Seyed Mostafa Tabatabaee Ghomscheh. Assessment of MoTiO3/GO Integrated Photocatalyst for Converting CO2 to Methanol. Chem. Methodol., 2022, 6(9) 699-709
)