Document Type : Original Article
Authors
Department of Chemical Engineering, Tarbiat Modares University, Tehran, Iran
Abstract
Among the important factors that affect the stability of 3D Perovskite cell are humidity, ultraviolet radiation, oxygen, and temperature. Therefore, different methods have been tried to solve the stability problem of perovskite material and increase the lifetime of perovskite solar cell. In this research, two strategies were used to improve the thermal, optical, and moisture stability of the material. The first strategy is to use four amino Azobenzenes and to halide them, which, due to the property of transitioning between their cis and trans spatial forms, absorbs harmful ultraviolet radiation and creates thermal balance, and thus improves stability. In this research, by reacting this material with chlorine, a new cation was prepared for the synthesis of two-dimensional perovskite. In the second strategy, perovskite solar cells were encapsulated using silica airgel minerals and epoxy resin adhesive. The stability of the devices exposed to the environment, UV light and 80-85% temperature was investigated. The results of optical and moisture stability show the stability improvement of encapsulated devices. According to test results in dark conditions, with ambient humidity of 27% or 30%, encapsulation has improved stability. After placing the best device for 30 days in the environment conditions, it has maintained approximately 71% of its efficiency. Also, in the results of the UV light and humidity test, the improvement of the performance of devices with encapsulation has been observed.
Graphical Abstract
)
Keywords
- Solar Panel Perovskite Solar Cell Encapsulation Silica Airgel Chlorinated Two
- Dimensional Epoxy Resin
Main Subjects
Introduction
Solar energy is one of the most important, widely used new, and renewable energies, which if it replaces fossil fuels, it can end the existing concerns about exhaustion and environmental pollution, and the existence of renewable energy sources to reduce the emission of carbon dioxide, methane, and other dangerous substances [1]. It is necessary and important [2]. Due to the fact that solar energy has a high potential and is one of the sources of free, clean energy supply and free from harmful environmental effects, it has become a reason that among the energy sources, solar energy attracts the attention of researchers in this field [3]. In addition, the production of energy through the sun for the earth is huge and extensive, and if only 1% of the earth's surface is covered with solar cells with 10% efficiency, the energy needed by the world can be provided [4]. The basis of photovoltaic technology is the conversion of sunlight into electricity and today it is used in many countries. In recent years, the use of conventional organic-mineral materials such as perovskite has attracted the attention of many researchers due to its superior capabilities in the construction of solar cells. These materials are electron and hole conductors, on the one hand, and light absorbers, on the other hand. Suitable optical properties, good excitability of charge carriers in addition to the relatively cheap and simple manufacturing process are other desirable features of perovskite solar cells [5]. The unique properties of perovskite led to further research to improve the performance and stability of these cells. The efforts made have caused a significant growth in the performance and improvement of the efficiency of these cells from approximately 3.9% to 25% [6].
The purpose of the research
In previous research and studies, three-dimensional perovskite materials have been used to increase the efficiency of perovskite solar cells due to their diverse characteristics and properties [7]. However, the main challenge is the low stability of these cells, which has been investigated in this research [8]. The main goal of this research is to increase the stability of perovskite solar cells, which is done in two ways. In the first path, a new two-dimensional cation is synthesized. In the second path, encapsulation with mineral silica airgel and epoxy resin, which prevents the penetration of moisture and oxygen, is used to improve stability [9].
Background research
The issue of stability in perovskite solar cells is a very important challenge that can be solved with two external and internal solutions. The external method includes the use of stable and hydrophobic electron transfer layers [10], organic and inorganic cavity layers [11], and device encapsulation [12], which leads to increasing the life of perovskites. For example, if TiO2 is used as the electron transfer layer, the stability of the devices will decrease under light [13]. Therefore, Shin et al. used BaSnO3 (LBSO) as the electron transfer layer and achieved a suitable optical stability and 21.2% efficiency [14-16]. In the internal method, new and resistant materials are used in the perovskite layer, and by modifying the structure, the optical, thermal, and moisture stability of the devices is improved [17]. 3D perovskites based on organic cations suffer from instability and are always subject to degradation due to heat, moisture, light, and oxygen. As mentioned, an important and significant approach in the stability of perovskites is the use of two-dimensional perovskites, which two-dimensional structures are divided into the following three important categories and are used:
- Two-dimensional perovskite as absorbent layer,
- 2D/3D mixed perovskite,
- Two-dimensional perovskites as a cover layer on the three-dimensional perovskite layer [18].
Each of which is explained below. In fact, two-dimensional perovskites have been introduced as light absorbers resistant to light and moisture. In other words, the internal (intrinsic) modification of the perovskite structure is the use of the composition engineering principle, which is one of the focused methods to improve the important issue of stability [19].
In general, the issues related to the stability of perovskite can be categorized as follows
- Moisture stability,
- Stability under UV light, and
- Thermal stability.
Materials and Methods
Materials required for encapsulation
Silica airgel
The unique characteristics of airgel insulation and silica airgel are part of airgel insulation, as described in Table 1.
Resin
The resin used in this research is epoxy resin (cationic photo initiator) which is cured by exposure to the UV400 light for approximately 3 minutes.
Two-dimensional cation synthesis
To produce a two-dimensional cation (chlorinated 4 amino azobenzene), combine 100 mg of the precursor, 4 amino azobenzene, with the non-polar solvent diethyl ether, which is used for washing, in a small balloon, as well as some table salt (NaCl) is mixed with sulfuric acid (H2SO4) in a big balloon and connected with the hose of these two balloons. When the salt reacts with sulfuric acid, HCL is produced and the resulting vapors enter the balloon containing 4 amino azo through the existing hose. Benzene and diethyl ether are added and 4 amino azo benzenes are chlorinated. The mechanism that occurs in this 4-aminobenzene chlorination reaction is as follows: HCL acid resulting from the reaction of table salt and sulfuric acid reacts with the amine part of 4-amino azobenzene and NH2 turns into NH3CL, that is, chlorine with the amine part of the reactant gives that in Figure 1, the structure of the synthesized material can be seen.
Basic materials and solvents used to make perovskite solar cells
Table 2 includes basic consumables and Table 3 includes consumable solvents.
Table 1: The unique characteristics of airgel and silica airgel insulators


Figure 1: The structure of the synthesized material (chlorinated)
Table 2: Materials needed in the manufacture of perovskite solar cells

Table 3: Consumable solvents

Fabrication and preparation of perovskite solar cells
In this research, FTO, which is conductive glass, has been used as the substrate. After cutting and numbering the FTO substrates according to Figure 2, to pattern the anode and prevent short-circuit conditions in the cell, the etching step was performed using zinc powder and hydrochloric acid on the FTO substrates. Then, the layers were washed respectively with water, dishwashing liquid, acetone, and ethanol in an ultrasonic bath (each for 15 minutes) and finally dried at 100 °C.
To prepare TiO2 hole blocking layer, TTIP solution in ethanol with conc. 0.044M was prepared and coated on FTO by spin coating method at RPM 2000 for 20 s, and then the layers were baked at 500 °C for half an hour. For coating the mesoporous TiO2 layer, a solution of TiO2 paste diluted in ethanol, with a weight ratio of 1:3:5, was prepared and rotated at a speed of 500 rpm for 30 s on the cavity blocking substrate at 500 °C. They were cooked for half an hour. The perovskite absorbent layer was prepared by a two-step rotating method. To prepare the perovskite solution, first, 461 mg of PbI2 or PbBr2 was dissolved in 1 mL of DMF or DMSO solvent and placed on a magnetic stirrer at 70 °C for 2 hours. Next, using a needle filter (PTFE (2 μm), this solution was filtered and layered on the mesoporous TiO2 substrate for 5 seconds with a rotation speed of 3000 rpm and 5 seconds with a rotation speed of 6500 rpm. Drying the layers on a hot plate, it was done for 3 minutes at 40 °C and then 5 minutes at 100 °C.
Thereafter, 200 microliters of a solution containing methylammonium iodide (CH3NH3I) in anhydrous isopropanol with a concentration of 7 mg/mL was poured on the sample and after a 20 second delay, the layer was indexed by rotating 4000 rpm. At this stage, the samples were immediately placed on a hot plate at 100 °C and heated for 5 minutes. This layering method of perovskite layer is a two-step method. After preparing the absorbent layer, the hole transfer layer made of P3HT was layered at 1000 rpm in 60 seconds. In the last step, by placing a mask on the samples, the gold cathode with a thickness of 100 nm was deposited by the thermal evaporation method in the PVD machine and at a pressure of 5-10 torr. Figure 3 shows a schematic image of the structure of a perovskite solar cell.

Figure 2: How to process FTO layers

Figure 3: Schematic and realistic images of the structure of perovskite solar ce
UV-Vis spectra, magnetic moment measurements, and molar conductivity
The UV-Vis spectrum of the pale yellow N-(4-Bromo-2-methylphenyl)-1-(furan-2-yl)methanimine (L-FSB) in (DMSO), solvent exhibited two absorption bands and high intensity at 288 nm and 34222 cm-1 and 330 nm and 30303 cm-1 are assigned to π→π* and n →π* for electronic transition of aromatic or furan ring and azomethine group, respectively [20].
Then, to observe the effect of 2D cation synthesis, 3D, 2D, 2D-3D, and only 2D cation devices were made by two-step deposition method in different time conditions to be placed on the hot plate. The description of depositions is as follows. It is as follows: For all the devices, 250 microliters of the prepared solution (10 mg of 4-amino azobenzene + 1cc of isopropanol) is taken and layered at 4000 rpm for 20 seconds. Then it is placed on a hot plate for 5 minutes at a temperature of 90 ᵒC. Now, to compare the layers, they are made according to Table 4 investigated by the UV-visible and XRD absorption tests.
Table 4: Different modes of layers (2D, 3D, and 2D-3D combination)

Encapsulation
In line with this research and investigating the effect of encapsulation in terms of stability, encapsulation of devices made by silica airgel and resin, each of which has been explained in the previous chapters, is done in 5 different ways, which are as follows and according to Table 5 is:
Reference device without any encapsulation.
Device only with resin (only epoxy resin is placed on the cell as an encapsulating material).
Device with combined (mixed) airgel and resin (resin and silica airgel are combined).
Double-layer device (first resin, and then airgel and mixed resin).
Three-layer device (first with airgel, and then mixed with resin, airgel, and then with airgel).
Virogel resin has been placed on all the devices with a brush in 4 different modes as mentioned above. After placing each of the layers, it is placed under UV light for curing with a power of 400 for 3 minutes, then to check the issue of stability. They have been subjected to various stability tests which are explained as follow.
Characterization of perovskite solar cells
To compare the performance, efficiency, and stability of solar cells, it is necessary to measure a series of quantities, which are discussed in the following.
Current-voltage measurement
One of the most important and common methods for measuring the performance of photovoltaic solar cells is current-voltage measurement. Normally, the standard radiation intensity of 1.5 AM is used, and the solar simulator with a radiation power of 100 mW/cm2 creates this radiation intensity. Then, using a potentiostat device, the appropriate voltage is applied to the solar cell and its I-V diagram is recorded. Figure 4 demonstrated the common current-voltage curve for an organic solar cell under light and darkness [3].
Open circuit voltage
The maximum voltage in a solar cell under light is called open circuit voltage (VOC). It takes place when the current in the cell is zero [21-23]. This parameter depends on the bandgap of the device and is measured based on the recombination of charge carriers in the device [24-26].
Short circuit current
Short circuit current is the maximum current, it is produced when there is no resistance in its path and it is shown as JSC. If the applied potential is equal to zero volts, a short circuit current is created [27]. It is suggested to measure the ability of instruments to produce carriers from incoming photons JSC, which depends on many factors in the measurement. Things like carrier lifetime, carrier emission length are all effective in measuring JSC of solar cell [28, 29].
Table 5: Non-encapsulated devices and encapsulated devices with 4 different modes

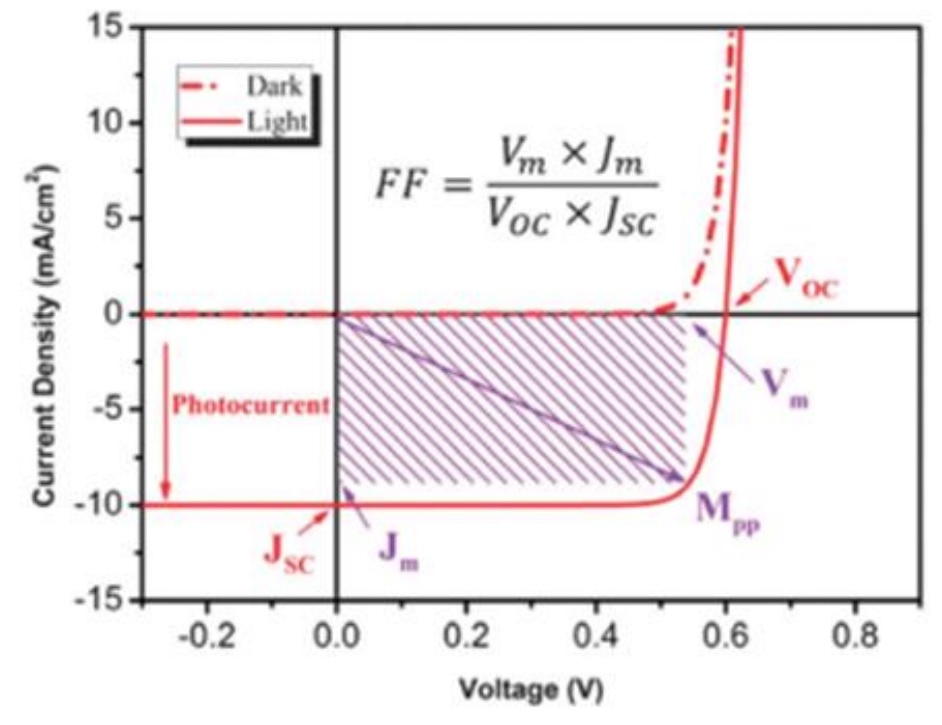
Figure 4: Current-voltage diagram of a solar cell [3]
Fill factor
One of the important factors in solar cells determining the efficiency of energy conversion is the filling factor. The filling factor known as FF is a parameter that specifies the ratio of the actual maximum power to the maximum power output from the cell by VOC and JSC [30-32]. In ideal conditions, the filling factor for the solar cell is considered to be one. At a certain point, the maximum power (PM) is produced by the specified current density and voltage (JM and VM) at the working point, which is calculated by the following equation [33-35].
![]()
X-ray diffraction analysis
XRD or X-ray diffraction test is an old and widely used technique in investigating the properties of crystals. In this method, X-ray diffraction by the sample is used to check the characteristics of the sample. To check the crystal structure of the investigated samples, they were characterized by XRD test (using a copper tube) in Tarbiat Modares University, Tehran, with 2ö, 5 to 50 degrees [36-38].
Visible-ultraviolet spectroscopy (UV-Vis)
When light shines on an object, it interacts with matter. When this light shines on the material, certain wavelengths are absorbed by the material [39]. Colors or wavelengths that are not absorbed by the object are reflected. The absorption spectrum is one of the characteristics used in analytical chemistry to determine the quantitative properties of substances. In visible-ultraviolet spectroscopy, part of the light is absorbed by the material and part of it passes through the material. The result of this spectroscopy is shown as a function of wavelength in the display. Since each material has its own absorption, there is a unique relationship between the material and the UV-VIS spectrum. The absorption spectroscopy of low-dimensional solar cells was recorded by a visible-ultraviolet spectrometer (Avantes) [40].
Fourier transform infrared spectrometry (FTIR)
Infrared spectroscopy is based on the absorption of radiation and investigation of vibrational transitions of molecules and polyatomic ions. This method is used as a powerful and developed method to determine the structure and measurement of chemical species. Likewise, this method is mainly used to identify organic compounds, because the spectra of these compounds are usually complex and have a large number of the maximum and the minimum peaks that can be used for comparative purposes [18]. There are two types of vibrations in molecules, which are called stretching and bending vibrations. Tensile vibration is divided into symmetrical and asymmetrical. Whenever an asymmetric stretching half-period occurs, the dipole moment will change in one direction, and in the other half-period, the dipole moment will move in the opposite direction. In this way, the dipole moment oscillates with the vibrational frequency of the molecule (this oscillation causes the molecule to raise to the infrared absorption band, and for this reason it is called infrared active) [4].
In the state of symmetric stretching vibration, two atoms move in different directions in a vibrational half-period, in which case the final change in the dipole moment of the molecule does not occur, and for this reason, it is called infrared passive. In this case, the change in intramolecular distances affects the polarizability of bonds. Therefore, there is a change in the polarizability of the molecule, and this is the state that is considered in Raman spectroscopy [14]. The interaction of infrared radiation with a sample changes the bond vibrational energy in its molecules and is a suitable method for identifying functional groups and molecular structure.
Results and Discussion
Characterization of the synthesized cation
In this part of the research, the chemical structure, optical characteristics, and crystallinity of the synthesized powder, which is used as a two-dimensional cation, will be investigated and compared with the precursor 4-aminoazobenzene.
Chemical structure of the synthesized bulk cation
FTIR test was used to check the chemical bonds in the examined samples. Figure 5 illustrates the FTIR spectra of 4-amino azobenzene and 4-amino azobenzene halides. In the FTIR spectrum of these samples, the peaks located in the wave number of about 3020 cm-1 in both samples are related to the stretching vibration of the C-H bonds on the aromatic rings [5] and multiple peaks located in the range of the wave number between 3200 cm-1 to 3500 cm-1 is related to the stretching vibration of O-H bonds (related to surface adsorbed water) and N-H in the structure [17]. Concerning that the structure of benzene rings is completely symmetrical, these rings and their C-H groups alone are not IR active, and if compounds are attached to these rings, these compounds become IR active. Therefore, with the increase in the number of structures connected to aromatic rings, it is expected that these C-H bonds connected to the ring will become more active and show more intensity. Therefore, the increased intensity of the peak related to the stretching vibration of the C-H bonds on the benzene rings in the sample containing chlorine compared to the sample of 4-amino azobenzene is the reason that chlorine is attached to this benzene structure. In the chlorine-free sample, the bending vibration of O-H bonds (related to surface absorbed moisture), the stretching vibrations of C=C bonds in aromatic rings, the stretching vibration of C-N bonds, and the stretching vibration of N=N bonds, respectively, in the wave number of 1620 cm-1,1599 cm-1,1504 cm-1, and 1414 cm-1 have shown absorption peaks [5]. The same bonds in the sample containing chlorine were shifted due to the presence of this element in the value structure and appeared in the wave numbers of 1653 cm-1, 1601 cm-1, 1545 cm-1, and 1449 cm-1, respectively. In the chlorine-free sample, the visible peaks at the wave number of 1305 cm-1 and 1138 cm-1 are related to the bending vibration of C-H bonds and the bending vibration of N-H bonds connected to the aromatic rings in the structure [58]. While the peak related to these bonds in the sample containing chlorine has been moved to the wave numbers of 1356 cm-1 and 1172 cm-1, respectively. The important visible peak at the wave number 892 cm-1 in the chlorinated 4-aminoazobenzene sample is related to the dancing vibration of the N-H bond in the NH3+ structure [21], which is not present in the 4-aminoazobenzene sample. The reason for the success of chlorination is the material structure. Also, the peaks located in the fingerprint area in the wave number range of 400 cm-1 to 1830 cm-1 are also related to the types of rocking, dancing, out-of-plane vibrations, and changes in the shape of C-H bonds in the structure of the investigated material [18].

Figure 5: FTIR spectra of 4-aminoazobenzene (black diagram) and chlorinated 4-aminoazobenzene (red diagram)
Optical properties of the synthesized cation
Figure 6 shows the UV-Vis spectra of 4-amino azobenzene samples and chlorinated (synthesized) substance.
According to the research of Shab Zindadar et al. [6], the π to π* electron transfer of the benzonide ring, and also the π to π* electron transfer of the trans-azobenzene group causes a peak around 330 nm. In addition, the conjugated structure of N=N as well as the electron transfer of n to π* related to the amino azobenzene units lead to a peak at 415 nm. Also, the n to π* electron transfer related to the benzonide ring has created a peak at wavelengths higher than 450 nm. It has been stated that if a bond is established between a chemical structure and an electron-donor or electron-acceptor substance, the peaks of the UV-Vis spectrum will shift to the left or right due to phenomena called hypsochromic shift and bathochromic shift, respectively, (lower or higher wavelengths) are moved [32]. Concerning that chlorine is a strongly electron-accepting element, its addition to the chemical structure shifts the peaks of the UV-Vis spectrum to lower wavelengths. Therefore, the reduction of the wavelength related to the mentioned electron transfer peaks in the presence of chlorine element in the AZO-Cl structure is fully justified. The bandgap energy value can be obtained by Tauc's equation (Relation (2)) [14].
![]()

Figure 6: UV-Vis spectra of 4-amino azobenzene samples and chlorinated (synthesized) substance
Where, hυ is the photon energy, α is the absorption coefficient, Eg is the bandgap energy, and A is a constant value. n is also equal to 0.5 or 2 for direct or indirect transmission, respectively. To obtain the value of the bandgap energy, the value of this parameter can be obtained by plotting the values of (αhυ)2 in terms of hυ and extending the linear area of the graph to the horizontal axis. In Figure 7, Tauc diagrams related to these two samples are drawn. Based on the graphs Depicted in Figure 7, it is clear that the band gap energy values for the samples of 4-aminoazobenzene and chlorinated substance are equal to 2.258 eV and 2.271 eV, respectively. Therefore, the presence of chlorine in the AZO structure has slightly increased the bandgap energy. In other words, since the amount of light absorption or electromagnetic radiation by semiconductors depends on their bandgap energy. Therefore, by preparing the chlorinated material, the light absorption or radiation properties have not changed much because the bandgap energy changes have not been significant.
Synthesized cation crystallinity
Figure 8 shows the X-ray diffraction pattern of 4-aminoazobenzene as a precursor for the preparation of two-dimensional cation and chlorinated 4-aminoazobenzene.

Figure 7: Tauc diagrams related to samples of 4-amino azobenzene and chlorinated substance (synthesized)

Figure 8: X-ray diffraction patterns related to the samples of 4-amito azobenzene and the synthesized substance
As it is clear from the figure, with the synthesis of the new cation, the crystal structure of the chlorinated 4-aminoazobenzene has completely changed and new peaks have been created. As we know, every material has a specific crystal structure, which by irradiating X-rays to that crystal structure at different angles and after reflecting the beam from the crystal plates of the material at specific angles (which is unique for each material), the pattern diffraction consists of different peaks, each peak representing one of the crystal planes of the material from which the X-ray plane is reflected at a certain angle.
Therefore, the diffraction pattern of any material is a collection of peaks that are unique to that material like a fingerprint. Therefore, whenever an unknown material is subjected to an XRD test and the obtained diffraction pattern is matched to the specific diffraction patterns of different materials, it can be claimed that the diffraction pattern is related to the material that has the most conformity with the diffraction pattern of that material. And in this way, the unknown substance can be identified. After chlorination of the structure, it is clear that the diffraction pattern of the sample is completely different, which indicates the change of the crystal structure of the material. In fact, unlike some other tests (such as FTIR) in which the whole spectrum is not changed with the creation of a new bond and only a new peak is removed or added, in the XRD test due to the change in the crystal structure of the substance after the chlorination process, the whole diffraction pattern has changed, which is a confirmation of the material's synthesis. To find the size of the crystal, the Debye-Scherr relation (Relation (3)) is used [25].
![]()
Where, D is the size of the crystal, K is a constant value known as the shape factor (equal to 0.9), λ is the wavelength of the X-ray used (equal to 1.54 Angstroms for the copper tube), FWHM of the desired peak width at half height, and θ is the place of occurrence. It is the peak, or in simpler words, it is the angle between the sample surface and the X-ray beam. Having the value of cos(θ) and FWHM from the diffraction pattern as well as the fixed values of λ (1.54 angstroms) and k (0.9), the value of the crystal size is obtained according to Scherer's equation, which considering that λ is in angstroms, this value is also based on It is in angstroms. The crystal size in nanometers is calculated by dividing the obtained value by 10.
To use this relationship, one of the peaks should be selected, where the extreme and single peak located at 2θ around 19.5° has been selected. Because the calculations are based on the intense peak (i.e. the double peak and not sunk together), it has less error, the more intense peak is used to get the crystal size) which by putting the information about this peak in the AZO sample in relation Scherer, the crystal size for this material is equal to 48.9 nm, while this parameter is equal to 100.7 nm in AZO-Cl sample. In the chlorinated (synthesized) sample, the peak with 2θ around 19.5° is used, although there is a stronger peak at 2θ around 10°, but because the peak is double, in other words, it seems that the two peaks have merged and such peaks lead to bandwidth at half height (FWHM) is not calculated correctly and for this reason, it is better to have a single peak and not a double peak which indicates a significant increase in the crystal size of the material by adding Cl to the crystal structure. In fact, due to the high volume of chlorine atom, adding this atom to the crystal structure has increased the structure volume significantly, and this can be another reason for the presence of chlorine in the structure of 4-aminoazobenzene, and these are proof reasons for synthesizing or in other words, it is 4-amino azobenzene for chlorination.
Characterization of 2D, 3D and combined 2D/3D perovskite layers
Examining the absorption spectrum results of perovskite layers containing two-dimensional cations: UV-Vis test was used to investigate the effect of composition, temperature and spin cutter rotation rate on the optical properties of produced perovskites and the results for 2D, 3D and 2D/3D samples are shown in Figure 9.
A new series of metal complexes of VO(II), Cr(III), Mn(II), Co(II), Ni(II), Cu(II), Zn(II), and Cd(II) have been coordinated with new Schiff base derived from (bma) and (fur), in an (1 to 2) ratio (metal to ligand) based on the results of metal content (A.A). All of these compounds characterized using different techniques: FT-IR, UV-Vis spectra, 1H-NMR, 13C-NMR, and mass spectra for ligand, magnetic moment and molar conductivity. FT-IR explains the metal coordinated through nitrogen atom of azomethine and oxygen atom of water. The FT-IR results of the ligand (L-FSB) were in good agreement with those obtained from 1H-NMR, 13C-NMR, and mass spectra. Conductance measurements values showed that VO(II), Cr(III), Co(II), Ni(II), Cu(II), and Zn(II) complexes are 1:1 electrolyte except Mn(II) and Cd(II) are non-electrolyte. The study of UV-Vis spectra and magnetic moment measurements support and confirmed the geometrical structure for all complexes are distorted octahedral except Zn(II) and Cd(II) complexes are tetrahedral. The biological analysis of (L-FSB) and its complexes against Staphylococcus aureus (G+), E.Coli (G-) bacteria, and Candida albicans was tested to understand the effect of binding metal ions to the (L-FSB) ligand. Antimicrobial study indicates that metal complexes show more inhibition than (L-FSB) ligand. According to Figure 9, the UV-Vis spectra of perovskite samples are similar to the spectra obtained in similar articles for 2D and 2D-3D perovskites [19]. In the spectrum of the synthesized material shown in Figure 9a, almost no peaks are visible, while with the formation of two-dimensional perovskite, intense peaks are observed, which confirms the formation of two-dimensional perovskite structure. According to this figure, it is clear that the most intense peak in samples with two-dimensional structure corresponds to sample 2D-6, in which perovskite was created at the highest rotation rate of the spin cutter (5000 rpm at 90 °C and 5 minutes). Also, the next sample with the highest peak intensity was related to samples 2D-4 and 2D-5, which, with the other parameters being constant, compared to sample 2D-6, only the rotation rate of the spin cutter was lower (4000 and 3000 rpm). These results show that increasing the speed of the spin cutter has more favorable results on the optical properties of the perovskite sample. By keeping the spin cutter rate constant at 4000 rpm and increasing the temperature from 90 °C to 100 °C (sample 2D-3), it is clear that the absorption intensity has decreased, which shows the unfavorable effect of temperature increase on the optical properties of perovskite. Also, in sample 2D-2, in which only the temperature has been reduced to 80˚C, one of the highest intensity peaks has been obtained in the blue region of the spectrum, which is another confirmation of the desirability of reducing the temperature on the optical properties of perovskite. Next is production. In Figure 9b, the presence of an absorption edge at a wavelength of about 750 to 800 nm confirms the existence of a three-dimensional perovskite structure and the existence of intense peaks proving the existence of a two-dimensional structure in the produced perovskite.

Figure 9: (a) UV-Vis test results (absorption spectrum) related to two-dimensional perovskite samples and (b) three-dimensional and two-dimensional-three-dimensional composite prepared at different values of deposition temperature and deposition speed
By comparing the absorption intensity in these samples, it is clear that the amount of absorption in sample 2D-3D-8 is higher than the other two samples, which is due to the lower spin rate in this sample compared to two samples 2D-3D-7 and 2D- 3D-9. This result indicates that, unlike the two-dimensional perovskite samples, in the two-dimensional-three-dimensional samples, increasing the rotation rate of the spin cutter had adverse effects on the optical properties of the structure. By comparing the absorption intensity for 2D and 2D-3D perovskite samples, it is clear that the absorption intensity is higher for 2D-3D samples and this indicates the more favorable effect of this compound on the optical properties of perovskite compared to 2D compounds. To investigate the effect of these changes in the perovskite production process on the band gap energy, the Tauc diagrams of the investigated samples are shown in Figure 10.
According to Figure 10a, the band gap energy value for the synthesized sample is equal to 2.22 eV, which is close to the value obtained for the raw sample of this material in Figure 6. Also, according to Figure 9b, the value of band gap energy for the pure three-dimensional sample is equal to 1.57 eV, which is the lowest value among the studied samples. For other samples (two-dimensional and two-dimensional and three-dimensional), two different band gap energy values have been obtained, which are related to the number of different layers in these samples. Bandgap energy values for these samples are reported in Table 6.

Figure 10: (a) Tauc diagrams related to 2D perovskites and (b) 3D samples and 2D-3D composites prepared at different temperature values and layer speed
Table 6: Bandgap energy values for the studied perovskite samples

According to the results reported in Table 6, it is clear that in the two-dimensional samples, the lowest band gap energy was related to the 2D-6 sample. Given that the lower the bandgap energy, the number of photons that can exhibit photovoltaic properties with sufficient energy increases. Therefore, the lower band gap energy in this sample can have a favorable effect in creating higher photovoltaic properties. Therefore, as previously stated, the optimal sample among two-dimensional perovskite samples is the composition produced at 90 ᵒC for 5 hours with a spin cutter rotation rate of 5000 rpm, and therefore, the higher the spin cutter rotation rate is for this category of samples are more favorable. Among the two-dimensional-three-dimensional samples, the 2D-3D-8 sample has the lowest band gap energy, and therefore, as mentioned before, in this category of samples, the spin rate is lower than 3000 rounds in minutes, temperature of 90 ᵒC and time of 5 minutes are optimal values. Furthermore, given that band gap energy values in 2D-3D samples are mostly lower than 2D samples. Therefore, this sample (2D-3D-8) can be considered as the optimal sample among all the examined samples.
Crystallinity of perovskite absorbent layers, 2D perovskite with different layering conditions and 2D/3D mixture
Figure 11 is related to the X-ray diffraction pattern of a two-dimensional perovskite layer sample with different layering conditions as an absorbent layer and a two-dimensional/three-dimensional mixture that is chlorinated with a two-dimensional cation (synthesized material). In other words, the X-ray diffraction pattern related to sample 7, which is detailed in the experimental section, has been analyzed and examined in a very complete manner in Figure 11. In the diffraction pattern shown in Figure 11, the peaks located at angles of about 12.7°, 25.8°, and 38.8° (indicated by empty circles), respectively, correspond to X-ray diffraction from plates (meaning plates, crystal plates which acts like a mirror for X-ray and re-radiates the beam and creates a peek inside the diffraction pattern, and because the orientation of these planes is unique for different materials, so the location of the peak is further unique inside the diffraction pattern and having a diffraction pattern, we can identify that material by matching it to the diffraction patterns of other materials.), (001), (011), and (110) structure of PbI2 with reference code JCPDS No. 01-075-0983 has a hexagonal crystal structure that is determined by X-pert software. Given that PbI2 remains unreacted (in other words, did not participate in the reaction), it is not desirable to reduce the amount of this substance in the desired final composition, therefore reducing the intensity of the peak related to this substance can mean the reduction of this impurity in be the final composition.
The peak located at an angle of about 9.6° (indicated by a red arrow), according to the similar articles, is related to diffraction from the (020) crystal plane of the 2D perovskite phase. The presence of this peak is the reason for the formation of the 2D structure next to the 3D structure in this sample. According to the research of Ishii et al. [x], the peak located at an angle of about 19.3° (marked by a solid triangle) is related to diffraction from the (200) plane of the CH3NH3-Pb-X structure. Also, the peak located at an angle of about 7.3° (specified by the hollow rhombus) can be caused by the diffraction from the crystal plane (001) of the chlorinated substance remaining in the sample. The presence of peaks located at angles of 14.1°, 24.7°, 28.6°, and 31.9° (indicated by the solid square) are, respectively, related to the diffraction from the (110), (202), (220), and (310) planes of the MAPbI3 crystal structure and the existence of a three-dimensional structure in this sample. To clarify the crystal planes in the 2D/3D mixed structure, the (110) and (220) planes of the MAPbI3 crystal structure, as well as the (200) plane of the CH3NH3-Pb-X crystal structure, which can be seen in the diffraction pattern, it is displayed in Figure 12.
.jpg)
Figure 11: X-ray diffraction pattern related to sample Y7 (2D/3D layered perovskite, temperature 90 °C, duration 5 minutes, and speed 4000 rpm)

Figure 12: The (110) and (220) planes of the MAPbI3 crystal structure as well as the (200) plane of the CH3NH3-Pb-X crystal structure in the mixed 2D/3D structure of sample 7
Photovoltaic characteristics and device stability
Figure 13 is a schematic of a perovskite solar cell and its corresponding energy balance diagrams. The absorbent material is placed between the spiro hole transporter and TiO2. In this structure, the holes are transferred to the external circuit by TiO2 through spiro and photon-excited electrons.
Using PCE, VOC, JSC, and FF parameters, the performance of solar cells is investigated. Results of efficiency and stability of perovskite devices encapsulated with mineral silica airgel and epoxy resin have been investigated. Figure 14 shows a schematic of encapsulation with silica airgel.
Function of solar cells
In Table 7, photovoltaic parameters for reference perovskite devices (without capsule), encapsulated with epoxy resin (R), mixed airgel, and resin ((R+A) mix), three layers (first airgel layer, layer containing A mixture of resin and airgel, and then airgel and in the walnut layer (first resin and then airgel) has been reported.

Figure 13: a) Schematic of different layers of perovskite solar cell b) Energy balance of layers

Figure 14: The form of encapsulation with silica airgel
Table 7: Photovoltaic parameters for perovskite devices

Sustainability results
In this research, to solve the issue of instability of perovskite solar cells, the encapsulation process with silica airgel materials and epoxy resin has been used. As explained in previous chapters, encapsulation leads to greater stability of perovskite solar cells against destructive factors due to the hydrophobic property of airgel material and the insulation property against oxygen and moisture of epoxy resin. For this purpose, the stability of non-encapsulated and encapsulated perovskite solar cells with different modes against destructive factors such as humidity, UV light, and darkness was tested and investigated, and the results of the tests are analyzed in the following.
Checking stability in ambient and dark conditions
In this part, the stability of the devices made with the best efficiency during the passage of time of 30 days from their construction has been investigated. During this period of 30 days, the devices have been kept in the conditions of ambient temperature and humidity of approximately 30%, and their stability test has been carried out in a certain time interval. The change graph of FF, PCE, VOC m, and JSC parameters of solar cells in terms of time is depicted in Figure 15. According to the results, the highest amount of efficiency loss is related to the device containing the perovskite absorbent layer without encapsulation, because it kept almost 25% of its efficiency, while the cells encapsulated with silica airgel and epoxy resin had better performances and kept more of their efficiency.

Figure 15: Stability of the devices (changes in PCE, FF, VOC, and JSC parameters) in a period of 30 days under the conditions of ambient temperature and relative humidity of 30%
Investigating the optical stability of solar cells
The optical stability of the un-encapsulated solar cell or the reference state and 4 different states encapsulated with silica airgel and epoxy resin were investigated for 120 minutes under the light irradiation with a radiation power density of 100 mWcm-2. Changes in PCE, FF, VOC, and JSC were recorded in the instruments with a time interval of 3 minutes. According to the results of the tests, the encapsulation process has led to improved stability. As can be seen in Figure 15, all the parameters of PCE, FF, VOC, and JSC of different devices are decreasing with the passage of time in front of the light, but the important thing is that the non-encapsulated device has the greatest drop in efficiency and has maintained less than 40% efficiency.
While the encapsulated perovskite solar devices performed better, so that the two-layer mode (resin+ A) 90%, the three-layer mode (A+(resin+ A) mix+ A)) 60%, the (resin+ A) mix mode 43%, and 40% resin mode have maintained their efficiency. It can be suggested that the encapsulated devices have almost constant changes in the FF parameter, but the reference mode has a 70% decrease. The VOC parameter has not changed much for most of the encapsulated devices, but it has decreased by 30% in the reference mode.

Figure 16: Optical stability of efficiency, fill factor, open circuit voltage, and short circuit current density (variations of PCE, FF, VOC, and JSC parameters) in un-encapsulated and encapsulated devices with different modes
Finally, it can be claimed that the encapsulated devices had better behavior and performance against the light-destroying agent, and it can be concluded that the capsule process with silica airgel and epoxy resin is an effective and useful factor in improving the stability and performance of solar cells.
Investigating the humidity stability of solar cells
The humidity stability of the devices was measured under light irradiation with a radiant power density of 100 mWcm-2 and relative humidity of 70-80% simultaneously for 100 minutes. As it is clear from the graphs obtained from the moisture stability test, it is clear that all parameters of PCE, FF, VOC, and JSC of different devices are decreasing with the passage of time against light and humidity.
The reference sample was able to maintain almost 10% of its efficiency, while the encapsulated devices were able to achieve 95% ((resin+ A) mix) mode, 60% three-layer A+(resin+ A) mix+ A mode, and 60% two-layer resin mode +A 50%, and resin state 40% of their efficiency because in the moisture stability test, the panels are affected by the two destructive factors of moisture and light simultaneously. For this reason, the devices are more destroyed and reduced in efficiency compared to the UV light test. In addition, according to the resulting graphs, the changes in FF, VOC, and JSC parameters in devices containing encapsulation are better than non-encapsulated devices. Hence, in general, it can be mentioned that encapsulated devices have better efficiency and performance (Figure 17).

Figure 17: Moisture stability (changes of PCE, FF, VOC, and JSC parameters) in non-encapsulated and encapsulated devices with different modes
According to the results obtained from the stability tests, as it is clear that it is explained in the results analysis of each of the tests. In general, the encapsulation process by Virogel epoxy resin has had a significant effect on improving stability and has shown better behavior against destructive factors than the reference state, and if based on the results of the analyzes carried out individually, this result can be concluded that in the dark stability tests of A+ (resin+ A) mix+ A state, in the stability test under UV light, (A+(resin+ A) mix+ A), and resin+ A are the best states because over time have maintained a higher level of efficiency and had more stability against destructive factors, and according to the results of the moisture stability test, the mixed state of airgel epoxy resin ((resin+ A) mix) was the best state, because it was in this state in the two tested samples. They have maintained the highest amount of efficiency compared to other modes and have been more stable. Therefore, in general, it can be mentioned that the presence of mixed Virogel epoxy resin is a suitable option in improving the stability of perovskite solar cells.
Conclusion
In this research, to improve the stability and performance of perovskite solar cell against destructive factors, two strategies were used, and in the first strategy, the synthesis of the two-dimensional cation 4-aminoazobenzene was carried out. In the second strategy, the devices made with silica airgel and epoxy resin were encapsulated in different states, to achieve the goal of this project, the use of this strategy led to improve the stability and performance of the perovskite solar cell against moisture, light, and environmental conditions.
Disclosure Statement
No potential conflict of interest was reported by the authors.
Funding
This research did not receive any specific grant from funding agencies in the public, commercial, or not-for-profit sectors.
Authors' Contributions
All authors contributed to data analysis, drafting, and revising of the paper and agreed to be responsible for all the aspects of this work.
Orcid
Faeze Baktash
https://orcid.org/0009-0006-8549-2121
Farzaneh Arabpour Roghabadi
https://orcid.org/0000-0003-2856-680X
Vahid Ahmadi
https://orcid.org/0000-0002-4131-2153
HOW TO CITE THIS ARTICLE
Faeze Baktash, Farzaneh Arabpour Roghabadi, Vahid Ahmadi. Improving the Performance of 3D Perovskite Solar Cell by Adding a Moisture Stable Layer. Chem. Methodol., 2023, 7(6) 460-482
)