Document Type : Original Article
Authors
1 Department of Physics, College of Science, University of Baghdad, Baghdad, Iraq
2 Department of Chemistry, College of Science, University of Baghdad, Baghdad, Iraq
Abstract
In this research study, Raman spectroscopy was utilized as a principal tool to assess the vibrational dynamics of carbon nanostructures (carbon allotropes) and develop a structural description. This work was concerned with carbon allotropes due to their various applications in many fields. Raman spectroscopy as a practical characterization technique of carbon allotropes was investigated. Also, the spectral analysis of FT-IR was presented too. Raman spectral analysis demonstrated the basic bands, including Radial breathing mode (RBM), G, D, and 2D-bands, which are affected due to structural differences of the carbon allotropes. This yields information about the crystal structure and its interesting physical properties.
Graphical Abstract
)
Keywords
Main Subjects
Introduction
Carbon is a prominent element due to its ability to form a variety of nanomaterials. Carbon allotropes are the structural modifications of a carbon element [1-3]. The unique structure and remarkable electronic properties of carbon allow for hybridization to build up sp3, sp2, and sp networks received specific attention for opening up the possibility of using the same material for various applications [2]. It is known to have distinct allotropes ranging from zero-dimension (0D) in fullerenes to one-dimension (1D) in carbon nanotubes and two-dimension (2D) in graphenes [4].
As a non-destructive analysis technique, Raman spectroscopy has become a powerful technique providing detailed information about the chemical structure form. It can rapidly identify the sample or distinguish it from others [5,6].
The technique has a sensitivity to the changes in the structures of carbon nanomaterials. That is significant for characterizing the differences of carbon allotropes structures [7,8].
Raman spectroscopy is the inelastic scattering of light associated with the emission or absorption of phonons [9]. The familiarity with the frequency shift of the scattered phonon yields Raman spectra in cm−1, which helps set apart the origin of an unspecified structure [10].
The Raman bands in the spectra include the Radial breathing mode (RBM), G-band, D-band, and 2D-band [11]. The analysis of such bands yields knowledge about the crystal structure, chemical structure, spatial arrangement of molecules, and crystallinity [4,5].
The G band (where the notation G comes from graphite) is related to the in-plane C‒C bond vibrational mode in graphitic materials and is prevalent in all sp2 carbon systems [4,12]. In contrast, the D band is known as the disorder, which refers to the crystallite degree in the graphene sheet [13]. The 2D-band is the second-order of the D-band display that well-built bands in the Raman spectra [3]. The ratio (ID/IG) is a common metric used to characterize the defect density in a material where IG and ID are the intensity of the G-band and D-band, respectively [4].
The explications of the Raman spectra of carbon structures species have been widely researched. However, it is thought of value importance to take up a comparing between different carbon structures. This work adopted Raman spectroscopy as a beneficial technique for providing information about the structure form for carbon allotropes. Taking into account the analysis of the spectral Raman bands. The Raman measurements and FT-IR spectroscopy give a complete set of analysis frequencies for fullerene, carbon nanotubes, and graphene.
There can usually be different combinations of two or more energy sources, but the most important is the combination of two or more renewable energies, including solar and wind energy. Combined energy is commonly used to generate electricity for domestic use and mills [12]. The use of hybrid energy is a method that has been considered in recent years. Combined power plants have proven to reduce the disadvantages of fossil fuels and can provide the energy needed in remote areas without harming the environment. Therefore, the construction of solar wind power plants can be a good idea (Figure 2).
Materials and Methods
This work adopted carbon allotropes. It was utilized specimens in powder form. The specification of the samples that were used involving:
Graphene (Average particle diameter = 15 um,Thickness: 6-8 nm, Purity: 99.5%). SWCNT (OD= 1-4 nm, ID= 0.8 – 1.6 nm, length = 5-30 um, Purity: 90%).
MWCNT) D= 8-20 nm, length = 5-10um, Purity: 95%),
MWCNT (D=40-60 nm, length = 5-10um, Purity: 99%),
Fullerene (spherical particles of D= 24.26 nm, Purity: 99%)
Characterization Techniques
Fourier Transform Infrared Spectroscopy (FT-IR)
The FT-IR was used to study the infrared spectrum of samples to measure the absorption of the materials. The wavelengths absorbed by the sample are characteristic of its molecular structure. FT-IR spectra have collected using (8400, SHIMADZACO., at the wavenumber of (400-4000) cm-1, using potassium bromide (KBr) disc).
Raman spectroscopy analysis.
Every band in the Raman spectrum corresponds to a particular vibrational frequency of molecular bond. Raman spectroscopy was employed to describe the vibrational molecular modes of concerned samples. Raman spectral analysis was carried out using (Bruker, senterra, 532 nm).
Results and Discussion
Fourier Transform Infrared Spectroscopy (FT-IR)
Fourier transform infrared spectra were carried out for graphene in Figure.1. The band 3438.8 cm-1 refers to O-H stretching. The bands of 1627 cm-1 and 1548 cm-1 are attributed to the graphene sheet, indicating the double bond C=C vibration of aromatic rings [14]. Other bands that contributed to a C-C stretch are near 1360 cm-1. The wideband with low O–H stretching intensity mightily suggest that it is not a functional group attached to the carbon networks [14]. Outright, this is typically pointed to graphene samples with few defects and high purity [15].
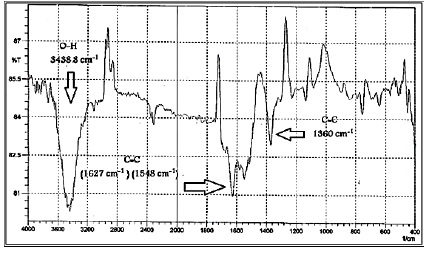
Figure 1: FT-IR spectrum for graphene
Figure 2 presents the FT-IR results for the SWCNT spectrum exhibiting several absorption bands at appointed regions. Distinctly, bands around 3446.5 cm-1 have absorption related to O-H stretching. The FT-IR spectrum detected the absorption band at 1639.38 cm-1 and 1633.59 cm-1. This assigns to the carbon units along the sidewall of the nanotubes [14].

Figure 2: FT-IR spectrum for SWCNT
Figures 3 a,b illustrate the spectral FT-IR performance for MWCNT. Results showed the typical O–H vibration bands around 3450 cm-1. The absorption in range (1620 cm-1 to 1650 cm-1) indicated the hexagonal structure of MWCNT that includes the presence of carbon double bonds. Other bands contributing to a C-C stretch are near (1330 - 1360 cm-1). It should be mentioned that the O-H vibration is debt to amorphous carbon because it facilely forms a bond with atmospheric air. However, the intensity of this O-H peak is relatively lower and shows that a lesser amount of amorphous carbon formed during growth [16,17].
The spectrum of the C60 revealed several relevant absorption bands at 525.5 and 574.7 cm-1, as shown in Figure 4. Attributed to C–C vibrational modes of the carbon atoms. The absorption band at 3452 cm-1 is attributed to O–H stretching and the absorption band at 1645 cm-1 refers to the C=C vibrational mode. The O–H stretching had broadband pointed that it made up of air adsorbed in pores of the sample rather than a functionalized group. This conclusion was supported because no broad bands were observed at 1100- 1300 cm-1 [14]. This observation showed that the used specimen was original C60 with high purity.
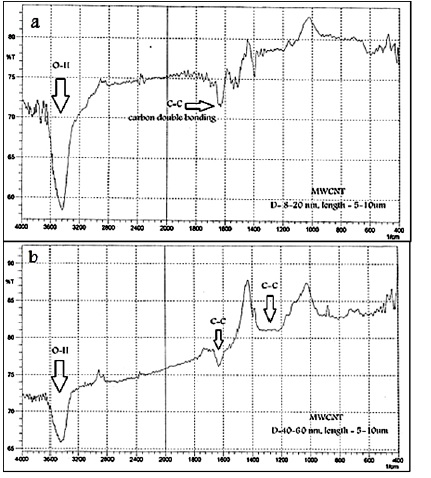
Figure 3 a,b: FT-IR spectra for MWCNT
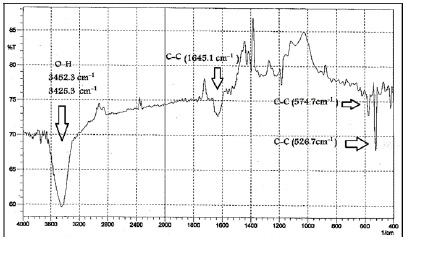
Figure 4: FT-IR spectrum for Fullerene
Raman Spectroscopy Analysis
The Raman spectrum of graphene is dominated by three principle vibrational bands involving G, D, and 2D bands, as seen in Figure 5. The G-band is related to the C‒C bond stretching mode. It is the Raman common signature for all the sp2 carbon materials [18,12]. The featured G band of graphene has appeared near 1580cm-1. It is susceptible to strain effects and is a good indicator of the number of graphene layers [12].
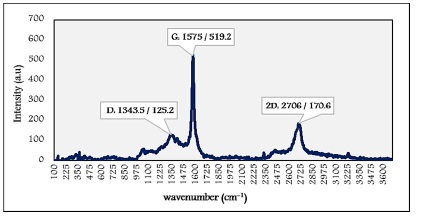
Figure 5: Raman spectrum of graphene
The presence of the D-band is located at 1343.5 cm-1, its intensity is very weak, indicating the high quality of the graphene specimen. The D band intensity is directly proportional to the degree of defects in the sample [19]. The exhibition of the 2D band is at 2706 cm-1. It is always in the graphene Raman spectrum, even when D band is present. The 2D band in the single-layer graphene (small thickness) is much more intense and severe than multi-layer graphene [12,19]. Here, the low intensity proved the large thickness of graphene specimen particles.
Raman spectroscopy is highly used for the characterization of carbon nanotubes. The Raman spectrum of SWCNT specimen peaks appeared in Figure 6. The Radial Breathing Mode (RBM) presented at 147 cm-1 and 261cm-1. The RBM is a signature of the presence of SWCNTs [7,19]. The Raman shift of RBM peaks (wRBM) is inversely proportional to the diameter of the tube, as follows,
ωRBM = A/dtube + B
dtube is the diameter of the tube, and the values of A and B vary depending on the environment. The signals of RBM are often used to analyze the dtube distribution of CNT samples [6,18].
The G-band is for the case of SWNT. It lies in the 1580 cm-1. The D-band was realized at 1345 cm-1. In the case of 2D-band appearing at 2667 cm-1, it is observed from graphitic materials even without defect structure [20].
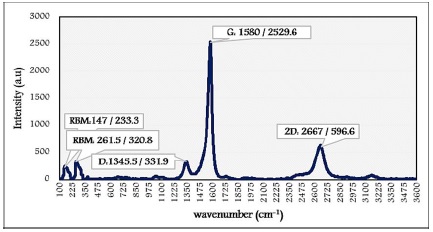
Figure 6: Raman spectrum of SWCNT
Distinctive changes are recognized from the Raman spectra of MWCNT. Due to the large diameter of the outer tubes and contain multiple tubes ranging from small to larger diameters [13]. Figures 7and 8 are the output of Raman spectra for MWCNT with different diameters. The performance yields the formal bands of MWCNT as one of carbon sp2 materials.
The difference between MWCNT and SWCNT is indicated by eliminating RBM bands in the lower wavenumbers region. They are valid for SWNCTs, and not present in the case of MWNCT due to the outer tubes that limited such modes [19]. The intensity of the G band in MWCNT is depressed due to the effect of the diameter distribution and assembly of the tubes in the case of MWCNT [13]. Accordingly, results were satisfied as the intensity of the G bands for MWCNT were lower than the ones for SWCNT.
For the case of MWCNT (D=8-20 nm, L=1-5 µm) demonstrated in Figure 7, the G band appeared at 1570 cm-1 with a higher intensity.
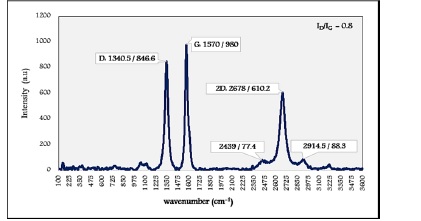
Figure 7: Raman spectrum of MWCNT (D=8-20 nm, L=5-10 µm)
MWCNT diameter increased as (D= 40-60 nm, L=1-5 µm), obviously, in Figure 8. G-band appeared at 1573 cm-1 with lower intensity affected by the diameter distribution.
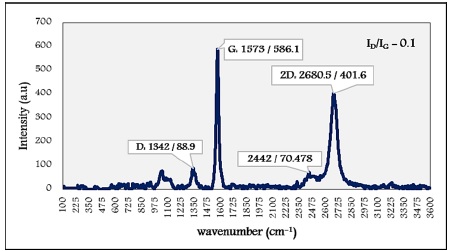
Figure 8: Raman spectrum of MWCNT (D= 40-60 nm, L=1-5 µm)
The presence of the D band for the case of MWCNTs is observed because of the arrangement of the multiple nanotubes indicating a more disorder in structure [6]. The D-band is an intrinsic feature of the MWCNT performance due to the curved nature of the graphite sheets [21].
Literature provided clear evidence that Nanotubes with smaller diameters have a higher curvature, and this cases defects in sidewalls [22]. So the highest intensity of the D band corresponds to the smaller diameter of MWCNT [21]. Spectral results of MWCNT confirmed such an approach where the D bands raised around 1340 cm-1.
The increase of defects concentration increases the intensity of the D band. The ratio ID/IG indicates some disorder in nanotubes [19]. The obtained ID/IG for the case of smaller diameter was higher valued than the situation of larger diameter.
The 2D peak intensity is related to the number of layers of nanotubes. The fewer layers have the higher intensity. Accordingly, this is achieved in the case of smaller diameters nanotubes [23]. Raman performance for the two specimens pointed that the larger diameter has a lower intensity of the 2D band, such as these bands showed up around 2680 cm-1.
It is known from the literature that the 2D band has a Lorentzian form in SWCNT, whereas in the graphite sheet of MWCNT, it has a low wavenumber shoulder [24]. Results showed this at wavenumber bands of 2439, 2914.5, and 2442 cm-1.
Looking at the Raman spectra for C60, there are three prominent bands labeled as Hg (1), Ag (1), and Ag (2) in Figure 9. The Raman peaks were labeled with their corresponding Mulliken symbols [25]. The main peak in the C60 spectrum is the highest intensity relatively sharp line at around 1459.5 cm-1. It corresponds to the pentagonal pinch mode [25, 26].
These measurements of the ordinary Raman spectrum of fullerene report that C60 is sp2 carbon material. Furthermore, the sharpness of the band reports the uniform and purity nature.
The marked bands in the spectrum correspond to other vibrational modes of fullerene located in lower positions at 276.5 cm-1 and 494 cm-1. The Raman spectrum allowed the appearance of additional lines with low vibration modes at 1328.5 cm-1 and 1567.5 cm-1.
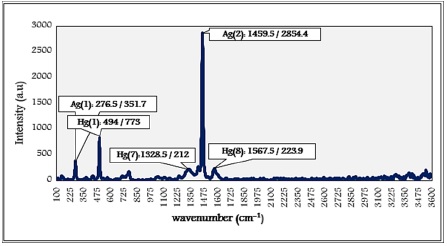
Figure 9: Raman spectrum of Fullerene
Conclusion
Raman spectroscopy is a powerful option for spectral analysis for carbon allotropes structures. The profiles of Raman spectra for carbon allotropes, the specifically intense bands D and G, were investigated where G band is a spectroscopic feature for the graphitic layers, and a typical D band is related to disorder in graphitic structures.
Results clarified that the ratio for the intensity of these bands namely ID/IG, measures the quality of concerning specimens.
This work has proven the discrimination of carbon nanotubes in the case of SWCNT and MWCNT dependent on the presence of RBM signals susceptible to smaller diameters. Easily was determined the effect of increasing diameters on the performance of Raman spectra for MWCNT in different situations conditions.
This work provided information for C60. The prominent bands had demonstrated in the Raman spectrum assisted in determining the particular structure of C60.
Funding
This research did not receive any specific grant from funding agencies in the public, commercial, or not-for-profit sectors.
Authors' contributions
All authors contributed toward data analysis, drafting and revising the paper and agreed to be responsible for all the aspects of this work.
Conflict of Interest
We have no conflicts of interest to disclose.
ORCID
Narmeen Ali Jasem:
https://www.orcid.org/0000-0003-0229-4180
HOW TO CITE THIS ARTICLE
Narmeen Ali Jasem, Mayada Badri Al-Quzweny, Abdulkareem M.A.Alsammarraie, Spectroscopic Investigation of Carbon Nanostructures. Chem. Methodol., 2022, 6(3) 237-245
DOI: 10.22034/chemm.2022.322390.1416
- Medjo R.E., Intech Open, 2013, 171 [Crossref], [Google Scholar], [Publisher]
- Manawi Y.M., Samara A., Al-Ansari T. Atieh M.A., Materials, 2018, 11:822 [Crossref], [Google Scholar], [Publisher]
- Estévez-Martínez Y., Durón Torres S.M., Alaníz Lumbreras D., Jiménez Sandoval S., Rámirez Palma M.T., González Arratia J., Cuevas Yañez E., Castaño V., Sci., 2017, 52:18 [Google Scholar], [Publisher]
- Saito R., Hofmann M., Dresselhaus G., Jorio A., Dresselhaus M.S., Phys., 2011, 60:413, [Crossref], [Google Scholar], [Publisher]
- Vaškova H., J. Math. Model. Methods Appl. Sci., 2011, 5:1205 [Google Scholar], [Publisher]
- Bîru E.I., Iovu H., Raman Spectrosc., 2018 [Google Scholar], [Publisher]
- Hodkiewicz J., Wall M., NSTI-Nanotech, 2010, 1 [Google Scholar]
- Bokobza L., Bruneel J.L., Couzi M., C—Journal of Carbon Research., 2015, 1:77 [Crossref], [Google Scholar], [Publisher]
- Cardona M., Light Scattering in Solids II., Springer, Berlin, 1982, 50:19 [Crossref], [Google Scholar], [Publisher]
- Haberer D., Nano Lett., 2010, 10:3360 [Crossref], [Google Scholar], [Publisher]
- Dresselhaus M.S., Jorio A., Hofmann M., Dresselhaus G., Saito R., Nano Lett., 2010, 10:751 [Crossref], [Google Scholar], [Publisher]
- Barron A.R., Taiwan MOOC OERs, 2015 [Google Scholar], [Publisher]
- Costa S., Borowiak-Palen E., Kruszynska M., Bachmatiuk A., Kalenczuk R.J., Sci. Pol., 2008, 26:433 [Google Scholar]
- Nandiyanto A.B.D., Oktiani R., Ragadhita R., J. Sci. Technol., 2019, 4:97 [Crossref], [Google Scholar], [Publisher]
- Batakliev T., Sci., 2019, 9:469 [Crossref], [Google Scholar], [Publisher]
- Hussain S., Jha P., Chouksey A., Raman R., Islam S.S., Islam T., Choudhary P.K., Mod. Phys., 2011, 2:538 [Crossref], [Google Scholar], [Publisher]
- Ghann W., Kang H., Rahman A.K., Rahman A., Ali M.M., Uddin J., Nanomed. Nanotechnol., 2019, 10:535 [Crossref], [Google Scholar], [Publisher]
- Tachibana M., Characterization of laser-induced defects and modification in carbon nanotubes by Raman spectroscopy, IntechOpen. 2013, 31 [Google Scholar], [Publisher]
- Orlando A., Franceschini F., Muscas C., Pidkova S., Bartoli M., Rovere M., Tagliaferro A., Chemosensors, 2021, 9:262 [Crossref], [Google Scholar], [Publisher]
- D'Souza F., Kadish K.M., eds., Handbook of carbon nano materials. World Scientific. 2012 [Google Scholar], [Publisher]
- Chaudharya K.T., Ali J., Yupapin P.P., Phys. B, 2014, 23:035203 [Google Scholar], [Publisher]
- Singh D.K., Iyer P.K., Giri P.K., Relat. Mater., 2010, 19:1281 [Crossref], [Google Scholar], [Publisher]
- Popov A.P., Dimitrieva A.I., Kovalenko A.V., Yumanov D.S., Stepanov A.V., Shemukhin A.A., Vorobyeva E.A., Elsehly E.M., Phys. Conf. Ser., 2020, 1611:012009 [Crossref], [Google Scholar], [Publisher]
- Keszler A.M., Nemes L., Ahmad S.R., Fang X., Optoelectron. Adv. Mater., 2004, 6:1269 [Crossref], [Google Scholar], [Publisher]
- Kuzmany H., Pfeiffer R., Hulman M., Kramberger C., Trans., Math. Phys. Eng. Sci., 2004, 362:2375 [Crossref], [Google Scholar], [Publisher]
- Khinevich N., Girel K., Bandarenka H., Salo V., Mosunov A., Phys. Conf. Ser., 2017, 917:062052 [Google Scholar], [Publisher]
)