Document Type : Original Article
Authors
1 Academic Center for Education, Culture & Research (ACECR), Kermanshah, Iran
2 Department of Chemistry, Payame Noor University, PO BOX 19395-3697, Tehran, Iran
Abstract
Encapsulation process is employed to preserve flavor from inadmissible interactions with food, minimizing flavor-flavor interactions, guarding in contradiction of light-induced reactions or oxidation, and increasing flavors shelf-life or allowing an organized release. The aim of this study is to define the preparation and benefits of encapsulation of Pistacia khinjuk gum essential oil as a flavor via nanoemulsion process. Nanoemulsion was prepared by sonicating technique with a probe-type ultrasonicator at varying amounts of surfactant and glycerol. The design expert software was used to optimize the size of nanoemulsion. The nanoemulsion was characterized by DLS analysis, and TEM. The antibacterial activity of nanoemulsion and gum essential oil was performed at four different levels (0.01, 0.1, 1, and 10 %) on ten strains of bacteria. The cytotoxicity of gum essential oil and nanoemulsion was also evaluated toward β-TC3, MCF7, and HT29 cell lines.
Graphical Abstract
)
Keywords
Main Subjects
Introduction
Edible additives are widely used in industry as flavors, colors, antimicrobial materials, vitamins, and others [1,2] . Flavor is one of key issues in determining consumer acceptance of a food product. Preserving of flavors is currently widespread as a focal point of food manufacturers as they are generally delicate and volatile. For example, if an aroma (flavor) compound concrete with a food composition, its volatility decreases and it is not released into the gas phase. On the other hand, the food matrix is a totally complicated gadget with many substances, including carbohydrates, proteins, stabilizers, thickening agents, and so on. These mentioned ingredients could interact with flavor mixtures and alter the flavor index (e.g., detract the severity and miss favorable flavor taste), which sometimes can be undesirable for consumers. In spite of interactions with food compositions, the flavors are subjected to chemical deterioration during refinement and depository, and could be degraded by exposure to light, oxygen, and elevated temperature. To maintain flavor properties, encapsulation procedures have been commonly used to maintain their character and develop their attractiveness. Different skills have been employed to encapsulate flavors containing spray drying, extrusion, freeze-drying, coacervation, and nanoemulsion. However, the choice of suitable encapsulation skill belongs upon the end use of the product and the processing conditions involved in the making of the product [3-6]. Nowadays, most existing flavor compounds are manufactured via chemical synthesis or extraction from natural plant sources. The toxicity and adverse side effects of synthetic additives have led to more people desiring for using natural additives [7-9]. Essential oils with suitable properties such as high antibacterial character and low cytotoxicity have been identified as an excellent natural additive alternative to synthetic flavors in the food industry. Essential oils are oily, volatile, and aroma compounds obtained from the various organs of plants such as flowers, seeds, leaves, stems, roots, and branches, by physical methods, including extraction and distillation and widely used as food flavoring [10-12]. Pistacia Khinjuk is one of the key species classified into the Anacardiaceae family that grows in some Mediterranean countries and in Iran, it mainly distributed in the Zagros region. Its essential oil has anti-inflammatory, antioxidant, antitumor, anti-asthmatic, and antimicrobial properties [13, 14] . Besides, they prevent adverse changes in food including flavor and nutritional value [15]. To obtain the benefits of essential oils, they should be stable, and nanoemulsions of plant essential oils are one of new strategies in the food industry for stabilization. [8,16]. Nano-sized emulsions are used in many industries such as food, agrochemicals, paint, oils and, preferably in pharmaceutical applications, as novel nanoparticle-based systems [17-19]. The purpose of this study is to stabilize P. khinjuk gums essential oil via a nanoemulsion procedure for application as a flavoring and anti-bacterial agents in the food industry. Various sections of the plant, containing resin, leaf, bark, fruit, and aerial parts can be used as a traditional medicine and in food industry as flavors [20,21]. They have been used for a long time as beneficial therapies for treatment and prevention of various kinds of diseases such as stomach discomfort, throat infections, burns, nausea, and toothache [13,22-25]. Furthermore, various studies have been conducted to determine their antioxidant and antimicrobial activity [26,30]. Herein, essential oil for nanoemulsion preparation was prepared from the exudates of the trunk. The most important compounds of the aforementioned essential oil is γ-terpinene. Some parameters affecting on the nanoemulsion size including the concentration of glycerol and surfactant (AOT), and power and time of sonication have been examined to obtain an optimum particle size (smaller size). The received data were statistically analyzed using Response Surface Methodology (RSM). To characterize the nanoemulsion, different techniques such as FT-IR spectroscopy, DLS analysis and TEM were employed. Furthermore, the antibacterial activity and cytotoxicity of nanoemulsion and gum essential oil was performed at different levels of specific bacteria and appropriate cell lines, respectively.
Material and Methods
Materials
khinjuk gums were accumulated from the exudates of the trunk of the P. khinjuk tree (from Oshtoran-Kooh Mountain, in Azna, Lorestan Province, Iran). Dioctyl sulfosuccinate sodium salt (AOT) was purchased from Merck (Germany). Glycerol was purchased from Kian Kaveh Azma (Iran). The water used for all experiments was deionized water. DMEM (Dulbecco's Modified Eagle's Medium) and Roswell Park Memorial Institute medium (RPMI) were obtained from Gibco, Scotland. Thiazolyl blue (MTT) was acquired from Merck, Germany.
Method
Extraction of the Essential Oil
To obtain essential oil, 30 g of fresh P. khinjuk gum was transferred to the Clevenger-type apparatus, and gum was distilled with water and maintained for 3 hours. The collected essential oil was dried using anhydrous sodium sulfate and kept in amber vials at 4 C. The extraction procedure was based on the British Pharmacopoeia [31] .
Preparation of Nanoemulsion
Nanoemulsion formulations were accumulated using spontaneous emulsification according to Bouchemal et al. [32]. Briefly, aqueous dispersions of nanoemulsion were composed of 2.5% (w/w) essential oil gum, glycerol at varied concentrations of 15-75% (w/w), AOT surfactant 5-10% (w/w), and different volumes of distilled water (the total volume of dispersion was kept 2 mL). The amount of essential oil was kept constant (50 μL; 2.5% (w/w)) at all levels of the testes. To obtain nanoemulsion, the prepared emulsion was placed in an ice-water bath and sonicated with a probe-type ultrasonicator (GM 2070, Bandelin, Germany) at 20 kHz for a specific time (60-80 s) and at specific power (20-60%). Figure 1 presents schematic illustration of the nanoemulsion preparation. The mean particle sizes of nanoemulsion were measured at 25 °C using Zetasizer (Zetasizer, Nano-ZS, Malvern Instruments Ltd., Worcestershire, UK). However, the effects of glycerol and surfactant concentration, time, and power of sonication were optimized to obtain a desirable average particle size (lower particle size) in nanoemulsion sample.

Figure 1: A schematic illustration of nanoemulsion preparation
Experimental Design
The Design-Expert software (Version 8.0.7.1, stat Ease, Inc., USA) was used to optimize the size of particles in nanoemulsions. The result of different factors on the response function (size of nanoemulsion) was examined using reply surface methodology (RSM) coupled with central composite design (CCD). As a result, to minimize the number of experiments and variables before experimental design, selection of the most affecting variables was done based on several experiments and the effect of different variables on response was examined, singly. In consequence, four variables (glycerol, AOT, ultrasonicator power, and time of sonication), having the most significant role in the size of nanoemulsions (response variable), were chosen. A assembled of 30 experiments were conducted singly to get the experimental response of size. The range of designed variables is listed in Table 1.
Table 1: The experimental parameters and the ranges of various levels
|
Variable |
Factor code |
Level and range (coded) |
||
|
-1 |
0 |
+1 |
||
|
The percentages of glycerol (%) |
A |
15 |
45 |
75 |
|
The percentages of AOT surfactant (%) |
B |
5 |
7.5 |
10 |
|
The power of ultrasonicator (%) |
C |
20 |
40 |
60 |
|
The time of sonication (s) |
D |
60 |
120 |
180 |
In addition, the software could organize a graphical analysis of the experimental data, which is helpful to specify the optimum combinations of variables [33]. The model's accuracy in fitting the polynomial equation could be evaluated by multiple correlation coefficients, R2, and adjusted R2.
Particle Size Measuring
The mean particle size of nanoemulsion was studied using a dynamic light scattering (DLS) at 25 C with a 632.8 nm He-Ne laser beam equipped with a backscatter detector (173 ). The optimized nanoemulsion sample was analyzed one day after preparation and subsequently on six weeks to study their stability.
GC-MS Analysis
GC-MS was used to analyze the chemical composition of essential oil. The GC-MS was used with a gas chromatograph and a mass spectrometer. The GC/MS was performed with helium as the carrier gas at a rate of 0.9 mL/min. The temperature ramp was started at 50°C and the column was held at 280°C for 5.83 min. The splitless injection was performed and the mass spectrometer was set at 70 V and used with a MZ 40-400 mass range. The scan rate was 0.2 s. The temperature of transmission line and the ionization source temperature were 280 and 230°C, respectively. cComponents were identified by comparing their historical mass spectra with those of the reference compounds in the National Institute of Standards and Technology (NIST) mass spectral library. Similarity was greater than or equal to 80%. The relative percentages of the substances were expressed as percentages by based on the normalization of peak area.
Transmission Electron Microscopy (TEM)
The morphology and structure of nanoemulsion sample were detected by TEM microscope. The nanoemulsion solution was employed on a carbon-coated copper grid, and then was dried at room temperature. The TEM images were acquired using a Zeiss-EM10C TEM (80 KV, Germany).
Cell Culture Conditions
β-TC (a mouse beta-pancreatic cell line), MCF7 (a human breast cancer cell line), and HT29 (a human colon adenocarcinoma cell line) were purchased from the Pasteur Institute in Iran. HT29 cells were grown in DMEM and β-TC preserved in high glucose Roswell Park Memorial Institute medium (RPMI) (Gibco, Scotland) completed by 10% (v/v) FBS (fetal bovine serum) and penicillin/streptomycin (100 U/ml, 100mg/ml) at 37C in a humidified atmosphere of 5% CO2. The cells were subcultured frequently using trypsin-ethylenediamine tetraacetic acid (EDTA-PBS) solution (Ben Yakhte, Iran).
Cell Viability Assay
The thiazolyl blue assay is used to measure the viability of cells. This test involves adding a MTT to cells, and then measuring how much of blue insoluble formazan in the produced cells [34].
Antibacterial Test
coli, Enterococcus, Citrobacter ferundii, Serratia marscecens, Pseudomonas aeruginosa, Entero cocci, Salmonella typhi, Proteus mirabilis, Staphylococcus aureus, and Acinobacter boumannii as standard strains (from Microbiology Laboratory of Imam Khomeini Hospital (Kermanshah, Iran)) were used in this study (Table 2).
Table 2: The bacteria types and their standard strain code for antibacterial tests
|
No. |
Bacteria Type |
Standard Strains Code |
|
1 |
E.coli |
ATCC:25922 |
|
2 |
Enterococcus |
ATCC: 23355 |
|
3 |
Citrobacter ferundii |
ATCC:8090 |
|
4 |
Serratia marcescens |
ATCC:13880 |
|
5 |
Pseudomonas aeruginosa |
ATCC:10662 |
|
6 |
Entero cocci |
ATCC:6057 |
|
7 |
Salmonella typhi |
Clinical |
|
8 |
Proteus mirabilis |
ATCC:7002 |
|
9 |
Staphylococcus aureus |
ATCC:6538 |
|
10 |
Acinobacter bsumsnnii |
ATCC :BAA-747 |
For this purpose, serial dilutions (0.01, 0.1, 1, and 10%) of essential oil of gum and nanoemulsion samples were made in Mueller-Hinton Broth containing 5% DMSO for bacteria, in 96-well microtiter plates. 20 µl of new microbial suspensions were prepared from overnight grown cultures containing 1.5 × 10⁸ organisms/mL and added to each well of 96-well microtiter plates.
The final volume of culture was 200 µL per each well. The ampicillin and DMSO were used as positive and negative controls, respectively. MTT (Sigma, U.S.A.) (3-(4,5-dimethylthiazol-2-yl)-2,5-diphenyltetrazolium bromide) assay was performed to assess the MIC of essential oil of gum and nanoemulsion samples. The nanoemulsion concentration, which completely inhibits the growth of microorganisms (MIC), was determined by a micro-well dilution method and values were determined by broth microdeletion assay recommended by the CLSI. The MBC is defined as the lowest concentration of sample at which microorganism is completely killed.
MTT was dissolved in PBS (pH 7.2) to obtain a concentration of 5.0 mg/mL. 20 μL of the MTT solution was then added to each culture well, and the plates incubated for 1 h at 37 °C. The MIC was taken for well, where no change in color of yellow MTT solution was observed. The MIC and MBC determination were duplicate.
Experimental Design
Fitting the Response Surface Models
In this study, a central composite design was used to analyze the effect of different variables on the nanoemulsion size. This was done by creating a model that fit the data, and then choosing the best conditions for nanoemulsion production. Variables included the percentage of glycerol, surfactant, the ultrasonicator power, and the sonication time. The results showed that having a higher percentage of glycerol led to smaller nanoemulsions, while using a stronger ultrasonicator caused them to form larger droplets (Table 3). Sonication for a longer time also resulted in smaller nanoemulsions.
The equation 1 that fit the data well was a quadratic polynomial. This equation is given as follows in terms of codes and actual factors:
Size = +186.58 - 27.28 A - 25.07 B - 15.11 C - 32.01 D + 7.18 BC + 21.94 B2 +24.59 D2 (1)
Where, A is the percentages of glycerol, B is the percentage of surfactant (AOT), C is the power of ultrasonicator, and D is the sonication time, respectively.
Table 3: The set of experiments and particle sizes of obtained nanoemolsions
|
Factor A* |
Factor B** |
Factor C*** |
Factor D**** |
Particle Size (nm) |
|
1 |
75 |
10 |
20 |
180 |
|
2 |
45 |
7.5 |
40 |
120 |
|
3 |
75 |
10 |
60 |
180 |
|
4 |
45 |
7.5 |
40 |
120 |
|
5 |
15 |
5 |
60 |
180 |
|
6 |
15 |
5 |
20 |
180 |
|
7 |
15 |
5 |
60 |
60 |
|
8 |
45 |
5 |
40 |
120 |
|
9 |
75 |
5 |
60 |
60 |
|
10 |
45 |
7.5 |
40 |
120 |
|
11 |
15 |
10 |
20 |
60 |
|
12 |
15 |
10 |
60 |
180 |
|
13 |
45 |
7.5 |
20 |
120 |
|
14 |
45 |
10 |
40 |
120 |
|
15 |
15 |
5 |
20 |
60 |
|
16 |
15 |
10 |
20 |
180 |
|
17 |
75 |
5 |
20 |
60 |
|
18 |
45 |
7.5 |
60 |
120 |
|
19 |
45 |
7.5 |
40 |
120 |
|
20 |
45 |
7.5 |
40 |
180 |
|
21 |
15 |
7.5 |
40 |
120 |
|
22 |
75 |
7.5 |
40 |
120 |
|
23 |
75 |
10 |
20 |
60 |
|
24 |
45 |
7.5 |
40 |
120 |
|
25 |
75 |
5 |
60 |
180 |
|
26 |
75 |
5 |
20 |
180 |
|
27 |
15 |
10 |
60 |
60 |
|
28 |
75 |
10 |
60 |
60 |
|
29 |
45 |
7.5 |
40 |
60 |
|
30 |
45 |
7.5 |
40 |
120 |
|
*Glycerol percentages (%) **AOT percentages (%) ***Power of ultrasonicator (%) ****Sonication time (s) |
||||
The analysis of variance was used to see if the model terms were statistically significant (Table 4). This showed that variables in the model were affecting the responses (p-values<0.05), which is important because it means that the terms are actually affecting the data. According to the p-values, all of the terms in the model were significant. However, the terms with the biggest effect were the ones that affected the particle size of nanoemulsion the most.
Table 4: The ANOVA results of the designed model
|
Prob> F |
P-Value |
F-Value |
Mean Square |
DF |
Squares |
Source |
|
|
Significant |
<0/0001 |
49.55 |
8785.84 |
7 |
61500.85 |
Model |
|
|
|
<0/0001 |
75.53 |
13393.39 |
1 |
13393.39 |
A* |
|
|
|
<0/0001 |
63.78 |
11310.08 |
1 |
11310.08 |
B** |
|
|
|
<0/0001 |
23.18 |
4110.22 |
1 |
4110.22 |
C*** |
|
|
|
<0/0001 |
103.98 |
18438.40 |
1 |
18438.40 |
D**** |
|
|
|
0.0424 |
4.64 |
823.69 |
1 |
823.69 |
BC |
|
|
|
0.0058 |
9.35 |
1657.39 |
1 |
1657.35 |
B2 |
|
|
|
0.0024 |
11.74 |
2081.98 |
1 |
2081.98 |
D2 |
|
|
|
|
|
177.32 |
22 |
3901.24 |
Residual |
|
|
not significant |
0.1421 |
2.66 |
206.61 |
17 |
3512.33 |
Lack of Fit |
|
|
|
|
|
77.78 |
5 |
388.91 |
Pure Error |
|
|
|
|
|
|
29 |
65402.09 |
Cor Total |
|
|
*Glycerol percentages (%) **AOT percentages (%) ***Probe ultrasonicator power (%) ****Sonication time (s) |
|
||||||
Validation of Models
The coefficient of determination (R2), adjusted R2, and predicted R2 of the model was found at 0.9403, 0.9214, and 0.8762, respectively. These values show a good agreement between the model and actual results. Prediction error (PE) of the model can be another criterion to evaluate the accuracy of model, which is calculated by Equation 2 [35]:
(2)
The minimum size of nanoemulsion was obtained at glycerol percentage of 75%, AOT percentage of 10%, sonication power of 60%, and sonication time of 180 s. The experimental and predicted size of nanoemulsion was 140 and 144.9 nm, respectively. The prediction error was 0.034, which is less than 5%. This means that the model was able to predict and fit the experimental data. The graph of expected and actual values of size from nanoemulsion is displayed in Figure 2.
Using the regression equation, scientists can find the optimal values for the independent variables (glycerol and AOT percentages, power, and sonication time) that affect nanoemulsion size. The effects of each variable can be seen in two-dimensional contour plots and three-dimensional response surface plots. This information can help scientists make better decisions about what percentages of glycerol and AOT to use, and how much power and sonication time to use to create the perfect nanoemulsion. An emulsion has many small droplets that are tightly bound together. Surfactants help to break up the droplets and make them more surface area. This means that droplets are more likely to stay together and less likely to form larger droplets [36]. The glycerol behaves as a co-solvent and plays the main role in the appearance and the stability of nanoemulsion. Furthermore, Figure 3 obviously indicates that the nanoemulsion size can be increased by decreasing the ultrasonicator power. However, the minimum particle size of nanoemulsion was achieved at glycerol percentage of 75%, AOT percentage of 10%, sonication power of 60%, and sonication time of 180 s.
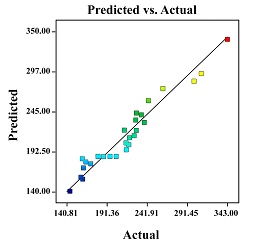
Figure 2: Comparison between model predicted and actual values of nanoemulsion particle sizes

Figure 3: The 3D plot of the effect of the percentages of AOT surfactant (B) and the sonication power on nanoemulsion particle size (C)
Stability of nanoemulsion
To prove the stability of optimum nanoparticles during the time, particle size was monitored for six weeks at 25 °C. Figure 4 shows the stability of this nanoemulsion system during the time. However, the optimum nanoemulsion sample demonstrated a good stability within six weeks of storage together with an increase in droplet size 144.9-266.9 nm. Similarly, Chanasattru et al. [37] and Sakulku et al. [36] reported that in a glycerol concentration of 50% in the aqueous phase and surfactant concentration of 10%, the mean size of the nanoemulsion particles grew after one month of storage.

Figure 4: Stability of nanoemulsion size within six weeks of storage at 25˚C (mean ± SD, n = 3)
Morphology of nanoemulsion
Nanoemulsion morphology was observed using transmission electron microscope to confirm the presence of nanoemulsion and provide morphological informations [38]. The nanoemulsion at optimum conditions was chosen for morphological study. The TEM result is demonstrated in Figure 5 (A-B). It is obvious that nanoemulsion is spherical without aggregation and adhesion. The nanoemulsion size was measured using Image J software and the size of nanoemulsion based on TEM image was found 112 ± 3.01 nm. This value 112 nm is closed to data from DLS method 144.63 nm ± 1.22 with hydrodynamic radius) and the TEM and DLS results (Figure 5C) were in a good agreement.
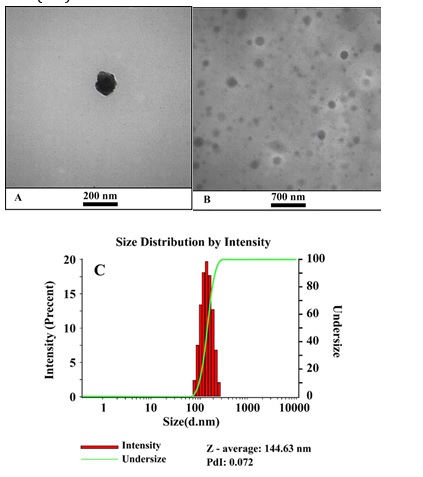
Figure 5: (A-B) TEM images and (C) the DLS of nanoemulsion sample
GC/MS analysis
Chemical constituents recognized by GC/MS. The results of the qualitative and quantitative analysis of essential oil are shown in Figure 76A. 36 compounds were, identified in the essential oil of P. khinjuk, and the main component was γ-terpinene (69.21%) (Table 5, Figure 6).
Table 5: GC-MS compounds of gum essential oil of P. khinjuk
|
No. |
Compounds major |
RTa |
Percentage (%) |
|
1 |
γ-Terpinene |
7.312 |
69.21 |
|
2 |
β–Pinene |
8.549 |
6.38 |
|
3 |
Sabinene |
8.401 |
5.51 |
|
4 |
Limonene |
10.563 |
2.16 |
|
5 |
Pra-cymene-8-ol |
17.59 |
0.59 |
|
6 |
α–Pinene |
13.514 |
0.13 |
|
7 |
β-Phellandrene |
23.283 |
1.04 |
|
8 |
Trans-Pinocarveol |
15.374 |
0.36 |
|
9 |
Myrtenal |
18.06 |
0.26 |
|
10 |
Berbenone |
18.70 |
0.22 |
|
11 |
Camphene |
7.52 |
0.1 |
|
12 |
Pinocarvone |
16.46 |
0.02 |
- RT = Retention Time
Measurement of antibacterial activity
The results in Table 8 shows the Minimum Inhibitory Concentration (MIC) and the Minimum Bactericidal Concentration (MBC) of gum essential oil against 10 strains of bacteria. The results of this study showed that essential oil had a significant inhibitory effect on nine strains of Enterococcus, Serratia marcescens, Pseudomonas aeruginosa, Enterobacter cloacea, E. coli, Salmonella typhi, Proteus mirabilis, Staphylococcus aurous, and Acinobacter baumanii and did not affect only on Citrobacter ferundii strain. Likewise, Table 6 shows the nanoemulsion effect on afformentioned strains of bacteria. The results showed that the nanoemulsion has a significant inhibitory potential on all ten strains of bacteria. α-Pinene, β-pinene, and γ-terpinene are the major combinations of P.khinjuk gum essential oil. Previous research results showed that α-pinene in P. khinjuk gum essential oil has a good antibacterial activity [40]. In addition, P. khinjuk gum essential oil and nanoemulsion contain phenolic compounds, terpenoids, and terpinene which are active against bacteria. The essential oil can coagulate the cytoplasm and damage proteins and lipids of bacteria. Damage to the cell wall and cell membrane results in the macromolecules permeability [41]. In recent years, it has been determined that some nano and microemulsion (oil-in-water) that are thermodynamically stable and transparent have antimicrobial properties. For example, antibacterial properties of nanoemulsions based on soybean oil, and stable microemulsions based on tween 80, pentanol and ethyl oleate have been proved. The mechanism of action of emulsions is through the disruption of viruses and bacteria membranes and discoloration of Bacillus spores [42].
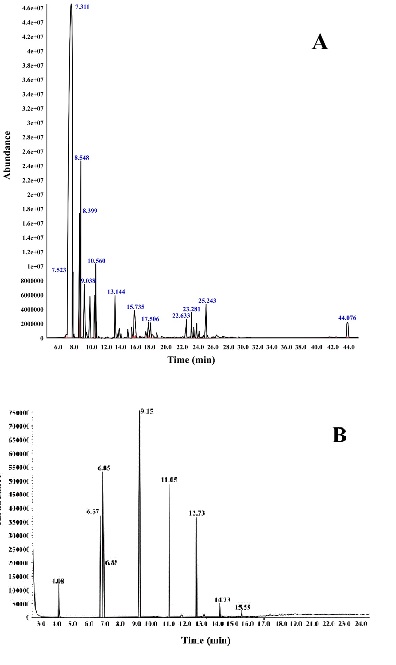
Figure 6: GC-MS spectra of P. khinjuk gum essential oil
Table 6: Antibacterial activity of gum essential oil and nanoemulsion
|
Strain bacteria |
Gum essential oil % |
Nanoemulsion |
||
|
MIC |
MBC |
MIC |
MBC |
|
|
E.coli |
0.01 |
0.01 |
1 |
1 |
|
Enterococcus |
0.01 |
1 |
1 |
1 |
|
Citrobacter ferundii |
- |
- |
10 |
10 |
|
Serratia marcescens |
0.1 |
1 |
1 |
1 |
|
Pseudomonas aeruginosa |
10 |
10 |
10 |
10 |
|
Enterobacter cloacae |
0.1 |
10 |
10 |
10 |
|
Salmonella typhi |
0.1 |
1 |
1 |
10 |
|
Proteus mirabilis |
10 |
10 |
10 |
10 |
|
Staphylococcus aureus |
1 |
10 |
10 |
10 |
|
Acinobacter bsumsnnii |
10 |
10 |
1 |
1 |
The cytotoxicity test
Three malignant cell lines were incubated with different concentrations of gum essential oil and corresponding nanoemulsion samples (1%, 0.5%, 0.25%, and 0.125% (w/v)) for 48 h, and their cytotoxicity was evaluated using MTT assay protocol (Figure 7). The MTT assay is a test used to measure the reduction of a yellow dye called tetrazolium salts. This test is used to see how active cells are, and it is interesting to note that essential oil and nanoemulsion had little or no anti-proliferative effect on three different cancer cell lines. However, nanoemulsion had a higher cytotoxic activity than pure gum essential oil. This suggests that nanoemulsion can be used as a flavor in the food industry, with the potential to have a cytotoxic effect on specific cancer cells [43].
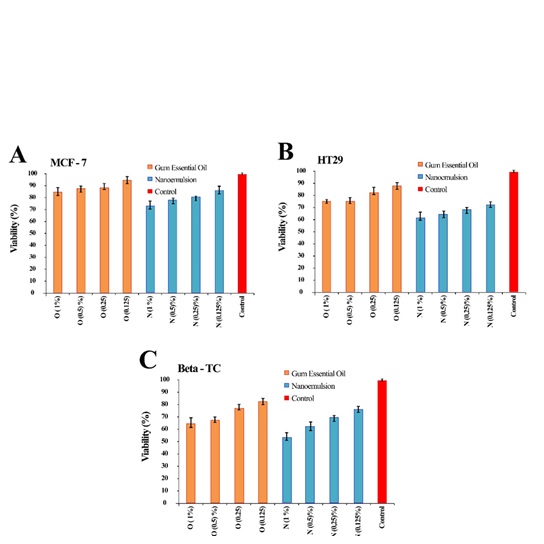
Figure 7: Cytotoxicity of nanoemulsion and gum essential oil samples on (A) MCF7, (B) HT29, and (C) β-TC cells line
Conclusion
In this study, the possibility of producing nanoemulsion from P. khinjuk gum essential oil was investigated to incapsulate the afformentioned essential oil as a flavor in food industry. Encapsulation is one of the most prevalent approaches to preserve flavors due to their volatility, which is a primary concern for food manufacturers. It is also considered as an appropriate technique to increase stability during storage. The production of nanoemulsion oil was optimized and the minimum particle size of nanoemulsion was achieved at glycerol percentage of 75%, AOT percentage of 10%, sonication power of 60%, and sonication time of 180 s. In addition, the nanoemulsion sample was characterized by analyses such as FT-IR spectrum, DLS, GC-Mass, and TEM microscopy. The FT-IR spectra confirmed the existing of the essential oil in the nanoemulsion. The optimized nanoemulsion showed size and PDI, at 144.63 nm and 0.066, respectively, which was in good agreement with TEM images. The results of antibacterial activity test showed that this nanoemulsion had a very good antibacterial activity, and especially in high concentrations of nanoemulsion had a significant effect on inhibiting the growth of microorganisms causing pathogenicity. The cytotoxicity results of the nanoemulsion toward β-TC3, MCF7, and HT29 cell lines revealed the nanoemulsion safety. The results of this study can be used for applying this essential oil nanoemulsion as a flavoring in the food industry.
CRediT authorship contribution statement
Masoumeh Khanahmadi and Fatemeh Shahrezaeia: Conceptualization, Methodology, Writing- original draft, Writing -review and editing, Visualization, Project administration, Funding acquisition. Mahdieh Sharifib and Ghasem Rezanejade: Formal analysis, Methodology, Writing- review and editing, Visualization.
Acknowledgements
The authors are grateful to the PNU for financial support of this work.
Conflict of interest
No potential conflict of interest was reported by the authors.
Funding
This research did not receive any specific grant from funding agencies in the public, commercial, or not-for-profit sectors.
Authors' contributions
All authors contributed to data analysis, drafting, and revising the article and agreed to be responsible for all the aspects of this work.
ORCID
Masoumeh Khanahmadi
https://orcid.org/0000-0003-0181-0868
Fatemeh Shahrezaei
https://orcid.org/0000-0003-2001-6336
Mahdieh Sharifi
https://orcid.org/0000-0003-1439-6790
Ghasem Rezanejade Bardajee
https://orcid.org/0000-0001-7331-0059
HOW TO CITE THIS ARTICLE
Masoumeh Khanahmadi, Fatemeh Shahrezaei, Mahdieh Sharifi, Ghasem Rezanejade Bardajee. Ultrasound-Assisted Preparation and Optimization of Natural Flavoring Nanoemulsion for Dairy Products Based on Pistacia Khinjuk in Lab Scale. Chem. Methodol., 2023, 7(7) 524-539
)