Document Type : Original Article
Authors
1 Ministry of Education, Anbar Education Directorate, Anbar, Iraq
2 Physics Department, College of Science, University of Baghdad, Baghdad, Iraq
3 Laboratory of Materials for Energy and Environment, and Modeling (LMEEM), Faculty of Sciences of Sfax, University of Sfax, B.P: 1171, 3038, Tunisia
Abstract
The spray pyrolysis technique is a versatile and cost-effective method for producing TiO2-NiO@In2O3 NCTFs on glass substrates with varying molar ratios. NCTFs have been studied for gas-sensing applications due to their excellent sensing properties. The films' structural, morphological, and gas-sensing characteristics were analyzed. The XRD analysis indicates that the NCTFs are polycrystalline, meaning that they are made up of many small crystals. The crystals are oriented in a random fashion, which is why the XRD pattern is broad. The anatase phase of TiO2 is a tetragonal crystal structure. The NiO and In2O3 phases are both cubic crystal structures. The presence of nanostructure cubic phases indicates that the nanoparticles in the films are small enough to significantly affect the crystal structure of the films. Scanning electron microscopy images showed surface homogeneity, with small granular grains of nanostructures without any cracks. The gas sensor created using the prepared samples showed high sensitivity to NO2 and H2S gases, and its sensitivity was measured at different operation temperatures, along with response and recovery times. The optical properties of In2O3 are affected by the addition of TiO2 and NiO impurities. The In2O3 transmittance increases as the NiO ratio increases and the TiO2 ratio decreases.
Graphical Abstract
)
Keywords
- TiO2-NiO@In2O3 NCTFs /glass substrate
- crystal structure
- high sensitivity
- NO2 and H2S gas sensors
- Optical properties
Main Subjects
Introduction
Thin-film semiconductor gas sensors are becoming increasingly popular for various applications, including environmental monitoring, industrial safety, and medical diagnostics. They offer a few advantages over other types of gas sensors, including high sensitivity, fast response time, and low cost. The high sensitivity and trustworthiness of thin-film semiconductor gas sensors make them ideal for applications where it is important to detect even very low concentrations of gases. They can be used to detect hazardous gases in the workplace, monitor air quality, and diagnose medical conditions [1,2]. Metal oxide gas sensors are a cost-effective and suitable option for detecting harmful gases. Various metal oxide gas sensors, ranging from thick to thin films, have been fabricated using metal oxides such as ZnO [3], TiO2 [4], multilayer-coated (SnO2-CuO), and TiO2-ZnO composite [5] for sensing H2S gas [6]. Recently, low-concentration gas sensors have also been reported [7]. Nanocrystalline metal oxides have attracted a lot of interest in sensing H2S gas at room temperature due to their following advantages high surface area, reduced grain boundaries, and enhanced charge carrier mobility [7]. In addition to these advantages, nanocrystalline metal oxides are also relatively inexpensive to produce, which makes them a cost-effective option for gas-sensing applications. NiO, TiO2, and In2O3 are often used for detecting toxic and pollutant gases due to their non-hygroscopic meaning that they do not absorb water from the air. This is an important property for gas sensors, as water vapor can interfere with the sensing process, non-toxic which makes them safe to use in applications, where people are exposed to the sensors, inorganic meaning that they are not made up of organic compounds [8]. This is an important property for gas sensors, as organic compounds can be flammable or explosive, polar meaning that they have a positive and negative end. This polarity allows them to interact with gases and to change their conductivity in the presence of gases, and their crystalline nature means that they have a regular atomic structure. This crystalline structure gives the materials their desired properties, such as high surface area and conductivity [8]. These materials are cheap, safe, and readily available, which makes them beneficial and applied in many devices such as sensors, transparent conductors, and surface acoustic wave devices [9-11]. These materials are often used in simple devices, such as paper cups and saltshakers. However, they can also be used in more complex devices, such as solar cells and medical implants. Due to their ease of fabrication, affordability, and compactness, these types of sensors are preferred. Metal oxide gas sensors have valence and conduction bands, just like semiconductors [9]. The gas sensing technique relies on the anisotropy of the electrical resistance of metal oxide thin films. The main sensing process involves the change of oxygen concentration on the surface of these metal oxides through adsorption and various catalytic reactions of oxidation and reduction of gaseous species. The electrical conductivity depends on the gas ambiance and the sensing material operation temperature when exposed to the test gas [12]. In a conductometric gas sensor, the sensing material is a semiconductor oxide, such as tin dioxide (SnO2) or zinc oxide (ZnO). These materials have a high electrical resistance in air, but their resistance decreases when they are exposed to certain gases, such as carbon monoxide (CO), nitrogen dioxide (NO2), and hydrogen (H2). This is because the gas molecules adsorb onto the surface of the semiconductor oxide and create a depletion layer, which reduces the number of free electrons in the material. This decrease in the number of free electrons leads to a decrease in the electrical conductivity of the material [13]. This study discusses the use of TiO2-NiO@In2O3 NCTFs as NO2 and H2S gas sensors at different operation temperatures. Individually, TiO2, NiO, and In2O3 films have proven successful in gas sensing applications.
Experimental
The TiO2-NiO@In2O3 NCTFs were prepared on glass substrates heated to 400 °C using the chemical spray pyrolysis technique. Prior to the deposition, there was a predetermined 30 cm gap between the sprayer head and the substrate. The glass substrates (2×2 cm2) were cleaned with acetone, ethanol, and deionized water using ultrasonic cleaning for 15 minutes, and then dried in an air oven at 100 °C for one hour. Indium chloride (InCl3, purity 99.99%, molecular weight 221.18 g/mole) and nickel chloride (NiCl2, quality 99.99%, molecular weight 129.5994 g/mole) were dissolved in 100 ml of deionized water to prepare (0.2M). A solution of 100ml with 0.2M titanium trichloride (TiCl3, purity of 99.99%, molecular weight of 154.22 g/mole) was also used. The solutions were mixed using a magnetic stirrer until completely dissolved, and the molarity (M) was calculated using Equating (1):
![]()
Where, Wt is the Weight of salt in grams, MWt is the molar weight typically in grams per mole, and V is the volume of the solution typically in liters. The NCTFs with various TiO2-NiO@In2O3 molar ratio 20:60:20, 30:50:20, 40:40:20, 50:30:20, and 60:20:20 were prepared. Field Emission Scanning Electron Microscope (FESEM) analysis (Inspect F50 FEI Company) is used to examine the surface morphology and composition of materials at high magnifications. It can be used to study the size, shape, and distribution of particles, as well as the presence of defects and other features on the surface of a material. The structure of the samples was then studied by XRD (6000 SHIMADZ) to determine the crystal structure and average crystallite size. The diffraction scans were collected over a (2θ) range varying from (10° to 80°) with CuK radiation. The sensing performance of the sensors to NO2 and H2S test gas was examined using a homemade gas-sensing system. The sample under test was heated using an electrical hot plate, and the effect of changing operating temperatures on sensing characterization was studied by regulating the variable electrical resistance used to control the electrical current passing through the hot plate element. The operating temperature of the sensor was monitored using a K-type thermocouple. A gas flowmeter was used to achieve the required gas concentration in the test chamber, and a digital millimeter (Victor 86B) was used to measure the change in resistance of the sample under test. After every gas exposure cycle, the air was allowed to pass into the test chamber for a refresh. The Lambda 365 is a double-beam UV-Vis spectrophotometer that can measure absorbance in the wavelength range of 190-1100 nm. It is a versatile instrument and a powerful tool for studying the optical properties of TiO2-NiO@In2O3 NCTFs that can be used for various applications, including the measurement of UV absorption.
It can be used to optimize the optical properties of the TiO2-NiO@In2O3 NCTFs for specific applications. The FluoroMax® Plus is a benchtop spectrofluorometer from HORIBA that is designed for the detection of emission spectra out to 1700 nm. It has a signal-to-noise ratio of 10.000:1 and is equipped with a xenon source.
Results and Discussion
Morphological properties
The polycrystallinity phase of the samples was confirmed by X-ray diffraction. The XRD patterns of the TiO2-NiO@In2O3 NCTFs obtained at different concentrations on glass substrates are displayed in Figure 1. All the observed diffraction peaks in these XRD patterns are well matched with tetragonal structure TiO2 anatase according to the standard JCPDS card No. 96-900-9087 (a=3.785Å, c=9.514Å, space group I4 md) [14,15], additional diffraction peaks corresponding to the NiO cubic phase according to the JCPDS card No.96-432-0488 (a=4.183Å, space group F m m) [16,17]. In addition to TiO2 and NiO diffraction peaks, the XRD patterns reveal additional diffraction peaks characteristic of the In2O3 cubic phase in agreement with the JCPDS Card data Card No.96–101-0488) (a=10.122Å, space group I213) [18,19].
Table 1 provides X-ray diffraction (XRD) data for different NCTFs with varying ratios of TiO2, NiO, and In2O3. In the context of X-ray diffraction (XRD), the FWHM of a peak can be used to estimate the crystallite size of the material that is being analyzed. The Scherrer equation is a mathematical formula that can be used to
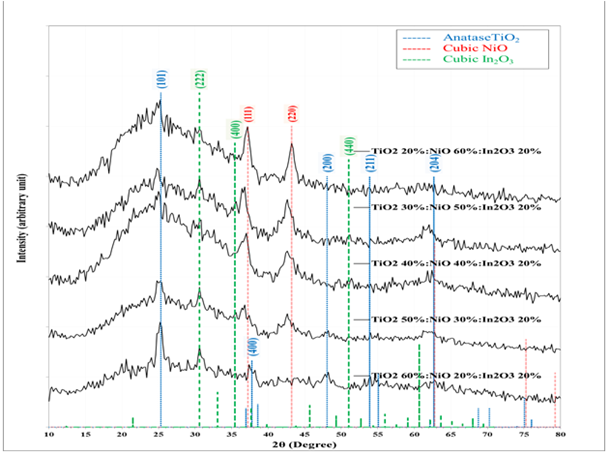
Figure 1: XRD of the TiO2-NiO@In2O3 NCTFs on glass substrate
calculate the crystallite size from the FWHM of an XRD peak, as described in Equation (2) [20]:
![]()
Where, l = 1.5418 Å for Cu radiation, θ is the diffraction angle, K = 0.9, and β is the FWHM The dhkl value is related to the spacing between crystal planes, and the (hkl) values correspond to the Miller indices of the crystal planes that are responsible for the diffraction peak. The D value represents the average size of the crystallites in the sample. Comparing the results of different nanocomposites, we can see that the values of 2θ, FWHM, and dhkl vary with the changing ratios of the constituent materials. For example, the peak at 25.2348° (110) of TiO2 is observed in all the nanocomposites, but the dhkl value changes from 3.52638 Å to 3.54855 Å, as the NiO content increases from 20% to 60%. Similarly, the peak at 30.6472 (222) of In2O3 is observed in all the nanocomposites, but the FWHM value changes from 0.8820 to 0.9221 as the TiO2 content decreases from 60% to 20%. The D values also vary with the composition of the nanocomposites. The D value of the (111) peak of NiO decreases from 11.6 nm to 6.8 nm as the TiO2 content decreases from 40% to 20%. To sum up, increasing the amount of NiO in the nanocomposite helps in promoting crystallization and reducing the crystallites size,
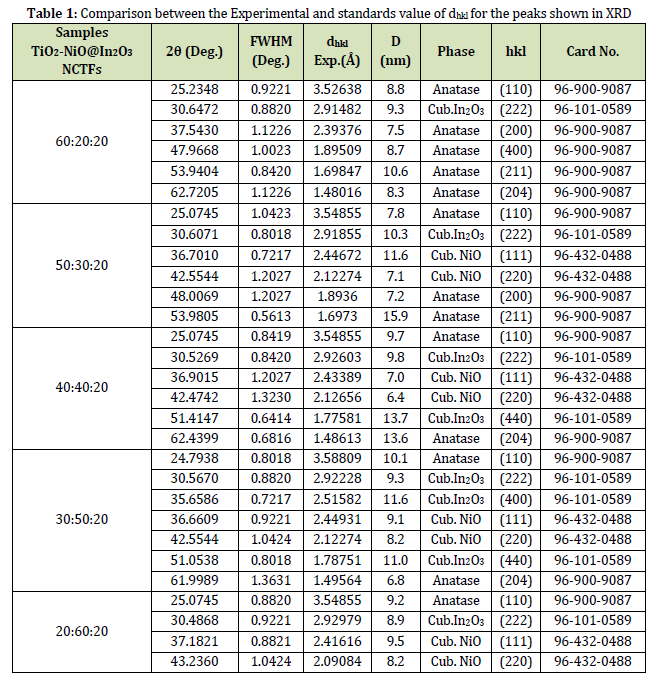
while the presence of In2O3 does not seem to have a significant effect.
The FESEM image of TiO2-NiO@In2O3 NCTFs (Figure 2) displays grass-like structures of nanoscale size. These structures exhibit homogeneous distribution with minimal voids and are aligned. In addition, polyhedral shells are present on the surface, distributed depressively on the substrate, with some lining up along the nanoparticle. The FESEM image reveals the presence of small granular grains on the surface, which are evenly distributed and devoid of any cracks. However, some white-colored patches can be observed on the film surface, possibly due to incomplete decomposition of the precursor salt. Furthermore, spherical grains with a size of 20-100 nm are visible, though FESEM data indicates that the grain size is larger than that estimated from XRD data.
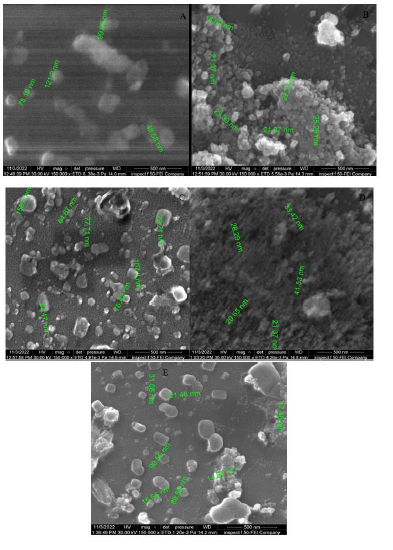
Figure 2: FESEM micrographs of TiO2-NiO@In2O3 NCTFs molar ratio: (A) 50:30:20, (B) 40:40:40, (C) 30:50:20, (D) 20:60:20, and (E) 60:20:20, respectively
Energy-dispersive X-ray spectroscopy (EDX) was employed to examine the composition of the samples that were examined by FESEM and XRD. EDX is a technique that can be used to identify the elements present in a material and to determine their relative concentrations. It works by shining a beam of electrons onto a sample and measuring the energy of the X-rays that are emitted. The different energies of the X-rays are characteristic of the different elements that are present in the sample. EDX was employed to analyze the composition of the synthesized TiO2-NiO@In2O3 NCTFs. The resulting EDX pattern in Figure 3 indicated the presence of Ni, Ti, In, and O, confirming that the nanostructure layer primarily consists of TiO2, NiO, and In2O3. The atomic percentages of these elements closely matched their theoretical values, supporting the formation of a TiO2-NiO@In2O3 NCTFs hybrid structure [1,22]. In addition, the EDX trace identified the presence of oxygen (O), silicon (Si), and calcium (Ca) elements in the glass substrate. The spectrum also revealed trace amounts of Cl, which originated from precursor TiCl3, NiCl, and InCl3 used in the deposition solution to form Cl atoms in the film.
TiO2-NiO@In2O3 NCTFs on a glass substrate sensitivity.
The sensitivity of the TiO2-NiO@In2O3 NCTFs on a glass substrate to NO2 and H2S gas as a function of temperature (operating at 150, 200, 250, and 300 °C) was examined in Figure 4. The films were studied using oxidizing gas (NO2) and reducing gas (H2S) with a concentration of (70 ppm) and (30 ppm), respectively. The results indicate that the films exhibit good sensitivity at all operating temperatures tested. Specifically, for a sample with a composition of 40:40:20, the highest sensitivity to 30 ppm H2S was observed at temperatures up to 200 °C, with a value of approximately 93%, while the maximum sensitivity of 70ppm NO2 gas was 56.4% at 150 °C operation temperature. This high sensitivity is attributed to the nano-sized nature of the films and the large amount of oxygen absorbed on the sample surface. The study investigated the response time and recovery time of gas sensor samples made from the TiO2: NiO: In2O3 NCTFs, for detecting NO2 and H2S gases, with different compositional ratios (20:60:20, 30:50:20, 40:40:20, 50:30:20, and 60:20:20). The operating temperature was varied to examine its effect on the response and recovery times of the samples. The study found that increasing the operating temperature led to shorter response and recovery times. Among the different compositional ratios tested, the 4:4:2 sample exhibited the fastest response time (4.5s) for NO2 gas and (6.3s) for H2S gas when operated at a temperature of 200 °C and 300 °C, respectively. The results are demonstrated in Figure 5. The primary surface reactions in gas sensing mechanisms are represented by chemisorbed oxygen and oxide gas. These reactions involve the adsorption of oxygen on the film surface in two forms: physisorption and chemisorption. At higher temperatures, chemisorption becomes the dominant process. The transition from physisorption to chemisorption necessitates activation energy, which can be attained by increasing the operating temperature. Increasing the temperature has been found to increase the amount of oxygen adsorbed on the sensor surface [22, 23]. In the temperature range of 150-300 °C, both oxygen molecules and oxygen atoms have a significant impact on the electrophysical and gas-sensing characteristics of the prepared samples. The adsorption of oxygen on the surface of metal oxide results in electron trapping, which reduces the charge carrier density and causes an increase in the resistance of the mixed samples. The oxygen (𝑂−) species on the surface of sample attract electrons, generating depletion layer that extends to both the particles and the surface barrier. The surface barrier plays a crucial role in the sensor's mechanism as it regulates the transfer of electrons between particles and the test gas, ultimately affecting the sensor material's overall resistance. When the sensor sample reaches its optimal operating temperature and oxygen species (𝑂−𝑠𝑢𝑟𝑓) adsorb, the coverage of oxygen on the sample surface increases, binding more electrons to the conduction band of the samples and raising the barrier. If the sensor sample is then exposed to NO2 test gas, this phenomenon reduces the conductivity or increases the resistance by increasing the depletion region. This effect can be attributed to the interaction between the NO2 gas and the oxygen species, which modifies the surface barrier and alters the transfer of electrons. The H2S reducing gas has the opposite behavior when interaction between the H2S gas and the oxygen species [24].
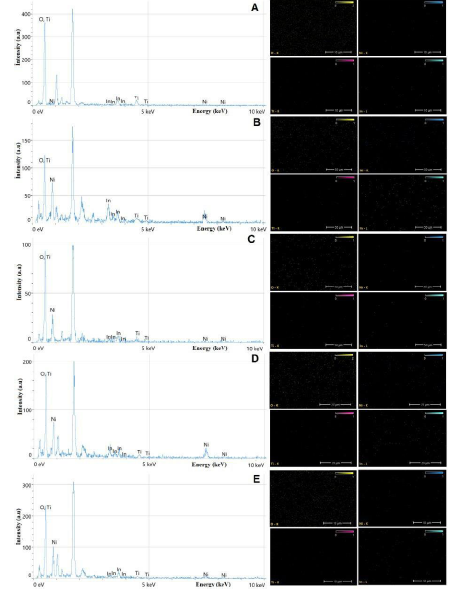
Figure 3: EDX results of TiO2-NiO@In2O3 NCTFs molar ratio: (A) 50:30:20, (B) 40:40:40, (C) 30:50:20, (D) 20:60:20, and (E) 60:20:20, respectively
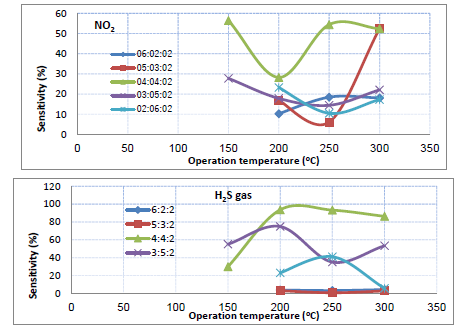
Figure 4: The variation of sensitivity with the operating temperature of the prepared, different mixed TiO2-NiO@In2O3 NCTFs to NO2 and H2S gases
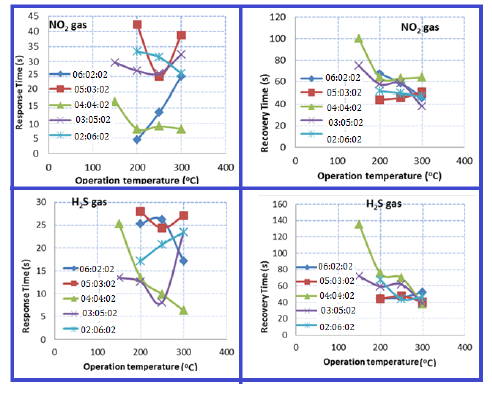
Figure 5: The variation of response time and recovery time with operation temperature of the prepared, different mixed TiO2-NiO@In2O3 NCTFs to NO2 and H2S gas
Figure 6 describes the response of a TiO2-NiO@In2O3 NCTFs (40:40:20) sensor to the presence of NO2 and H2S gases in a testing chamber at ambient air pressure and with a bias voltage of 3V. The sensor's resistance is measured over time, and it is observed that the resistance reaches a steady state before the gas is introduced. Once the H2S gas is introduced, the resistance sharply decreases to a new steady state, while introducing the NO2 gas increases the electrical resistance to a new steady state indicating that the sensor is detecting the gas presence. When the gases are switched off, the resistance returns to its initial state. The interaction between the surface atoms of the sensing film and the gas molecules is responsible for the sensor's ability to sense the presence of the gas. The NO2 and H2S gas have opposite behavior when interaction with sample surface indicating that the sample has higher selectivity of gases.
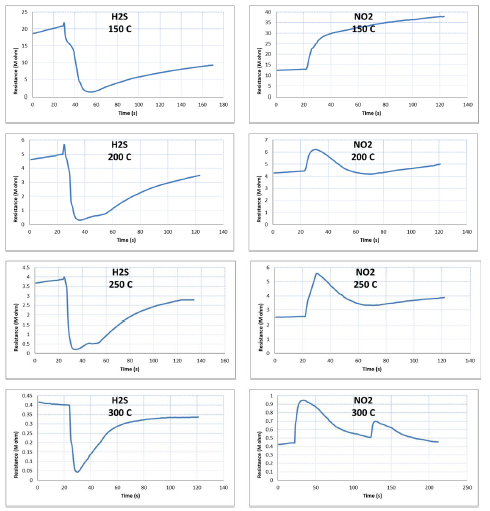
Figure 6: The variation resistance with time for different operation temperature of NO2 and H2S gases for mixed TiO2-NiO@In2O3 NCTFs molar ratio: 40:40:20 gas sensor
Optical study of TiO2-NiO@In2O3 NCTFs on a glass substrate
Compared to TiO2-NiO@In2O3 NCTFs (20:60:20), a red shifting in absorption edges towards UV region was observed in the TiO2-NiO@In2O3 NCTFs samples. The results in Figure 7(a) show that the addition of TiO2 and NiO to In2O3 can significantly decrease the absorbance of In2O3 under visible lights. This is due to the formation of a heterojunction between TiO2 and In2O3, as well as the presence of NiO, which can donate electrons to In2O3. This decrease in absorbance allows In2O3 to absorb visible light and promote the photocatalytic reactions [25]. This is because TiO2 is a wide bandgap semiconductor with an absorption edge in the ultraviolet (UV) region. In2O3 is also a wide bandgap semiconductor, but its absorption edge is in the visible region. When TiO2 and In2O3 are combined, the two materials form a heterojunction [25]. This heterojunction creates a new bandgap that is smaller than the bandgaps of either TiO2 or In2O3. This smaller bandgap allows In2O3 to absorb visible light, which it could not do on its own. Figure 7(b) shows the UV-Vis transmission spectra for TiO2-NiO@In2O3 NCTFs with various molar ratios. The intensity of transmittance spectra in In2O3 thin films increases with increasing wavelength, with increasing molar ratio of NiO because NiO is a good conductor of electricity. This means that the NiO-doped In2O3 films have a lower resistivity than the pure In2O3 films, and with decreasing molar ratio of TiO2 because TiO2 is a good absorber of light. This means that the TiO2-doped In2O3 films have a higher absorption coefficient than the pure In2O3 films. A region of high transmittance; that comprises the visible range, so a wide range of wavelength ranging from 320 to 800 nm and is in the order of 90% for all TiO2-NiO@In2O3 NCTFs samples. As you can see, NiO has the largest bandgap and TiO2 has the smallest bandgap. This is why In2O3 films with a higher NiO content will transmit lighter than In2O3 films with a higher TiO2 content. This high transparency is one of the essential characteristics and that fully justify the interest in TiO2 thin films [26]. The high transmittance of TiO2 thin films in the visible range is one of the essential characteristics making them so useful in various applications. Figure 7(c) illustrates the (ah)2 vs. photon energy (eV) plots for obtaining the band gap energy values. The band gaps shown in Figure 7 (c) and Table 2 of TiO2@In2O3 NCTFs with various molar ratio were changed from 4.079 for TiO2-NiO@In2O3 NCTFs (20:60:20) to 2.906 for TiO2-NiO@In2O3 NCTFs (60:20:20). Evidently, there was a gradual decrease in the In2O3 band gap energy with TiO2 and NiO-loading. The decrease in the band gap energy of In2O3 with TiO2 and NiO-loading has been used to improve the performance of In2O3-based photocatalysts for various applications, including CO2 reduction, water splitting, and organic pollutant degradation. The band gap energy of In2O3 is 3.7 eV, which is higher than the band gap energy of TiO2 (3.2 eV). The band gap energy of the In2O3 decreases when In2O3 is loaded with TiO2. This is because the TiO2 donates electrons to the In2O3, which narrows the band gap. The addition of TiO2 and NiO to the In2O3 systems further decreases the band gap energy [27]. This is because NiO is a metal that has very low band gap energy (2.2 eV). The optical properties of In2O3 are affected by the addition of TiO2 and NiO impurities. The In2O3 transmittance increases as the NiO ratio increases and the TiO2 ratio decreases. This is because NiO has a larger bandgap than TiO2, which means that it absorbs less light in the visible spectrum. As a result, In2O3 films with a higher NiO content will transmit lighter. TiO2, on the other hand, has a smaller bandgap than In2O3, which means that it absorbs more light in the visible spectrum. As a result, In2O3 films with a higher TiO2 content will transmit less light.
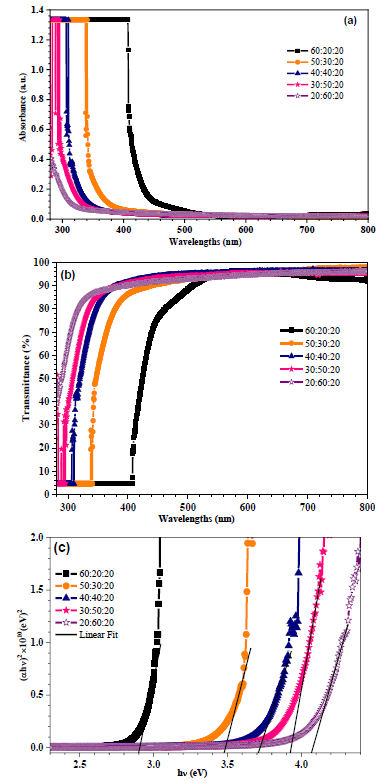
Figure 7: (a) UV-Visible absorption spectra, (b) Transmittance spectra, and (c) Optical band gap energies of the prepared mixed TiO2-NiO@In2O3 NCTFs for different molar ratio

Photoluminescence analysis of TiO2-NiO@In2O3 NCTFs on a glass substrate
Photoluminescence (PL) analysis is a useful technique for studying the optical properties of TiO2-NiO@In2O3 NCTFs on a glass substrate. The PL spectra of the prepared pure and mixed TiO2-NiO@In2O3 NCTFs for different molar ratios, obtained with excitation wavelength of 300 nm, 320 nm, and 350 nm, are illustrated in Figure 8 (a-c). The mixed TiO2-NiO@In2O3 NCTFs (30:50:20) enhances the PL intensity emission compared to the other composition thin film systems at 300 nm and 350 nm. This is because the specific composition of this system creates a favourable energy level alignment between the TiO2, NiO, and In2O3 structures [28]. This alignment leads to a more efficient energy transfer from the excited TiO2 nanoparticles to the NiO and In2O3 nanoparticles, which results in a higher PL emission intensity [29]. As a result, the mixed TiO2-NiO@In2O3 NCTFs (30:50:20) are a promising material for applications that require high PL emission intensity, such as light emitting diodes (LEDs) and solar cells.
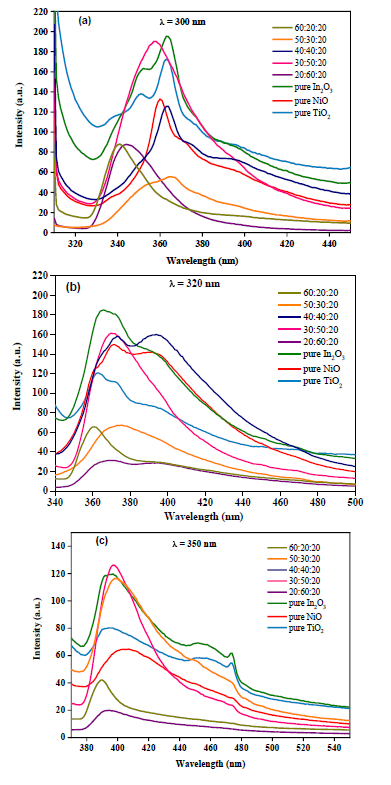
Figure 8: PL spectra of the prepared pure and mixed TiO2-NiO@In2O3 NCTFs with different molar ratio for excitation wavelength of (a) 300 nm, (b) 320 nm, and (c) 350 nm
Conclusion
To sum up, the TiO2-NiO@In2O3 NCTFs synthesized via a cost-effective spray pyrolysis method demonstrate excellent gas sensing properties. By varying the composition of the materials, the thin films can be tailored to exhibit different characteristics. The SEM and EDX analysis verified the presence of nano-sized particles and a nanostructured surface in the films. Among the different compositions tested, the TiO2-NiO@In2O3 NCTFs with ration (40:40:20) yielded the highest sensitivity, rapid response, and recovery times when detecting H2S gas. The sensor's resistance was measured under a bias voltage of 3V, and a significant decrease in resistance was observed upon the injection of H2S gas into the testing chamber, eventually reaching a new steady state, while NO2 gas has opposite behavior. Overall, the study highlights the potential of these TiO2-NiO@In2O3 NCTFs as efficient gas sensors with higher sensitive and selective applications. Optical properties of In2O3 were affected by the TiO2 and NiO addition. In fact, the transmittance increased as NiO ratio increased while TiO2 ratio decreased.
Disclosure Statement
No potential conflict of interest was reported by the authors.
Funding
This study did not receive any specific grant from funding agencies in the public, commercial, or not-for-profit sectors.
Authors' contributions
All authors contributed toward data analysis, drafting, and revising the paper and agreed to responsible for all the aspects of this work.
Conflict of interest
The authors declare that they have no conflicts of interest in this article.
ORCID
T Ibrahim
https://orcid.org/0000-0001-9796-9990
HOW TO CITE THIS ARTICLE
Abd Shahoodh, F.T. Ibrahim*, S. Guermazi, Investigations on TiO2-NiO@In2O3 Nanocomposite Thin Films (NCTFs) for Gas Sensing: Synthesis, Physical Characterization, and Detection of NO2 and H2S Gas Sensors. Chem. Methodol., 2023, 7(12) 994-1010.
)