7.4 (Q1)
CiteScore2024
CiteScore2024
Q2
Web of Science
Web of Science
Document Type : Original Article
Authors
Department of Chemistry, College of Science, University of Baghdad, Baghdad, Iraq
Graphical Abstract

Keywords
Subjects
Introduction
Atomic force microscopy is an instrument which is typically used for characterization and analysis of micro- and nano-scale features (high resolution between 100 µm to less than 1 µm. Its type of scanning is probe microscopy which invented by IBM scientists in 1985 [1].
The first experiment of the atomic force microscope was made by Quite, Binning and Gerber in 1986 [2].
The AFM is mainly composed of a cantilever (small spring) carried by the support, a piezoelectric material (ceramic) oscillates the cantilever, a sharp probe (tip) is fixed to the free end of the cantilever, and a detector which records the deflection and motion of the cantilever as displayed in Figure 1. The sample is placed on the sample specimen. The sample and sample stage moved in the x, y, and z axes in relation to the tip using a xyz drive.
The cantilever has scans across the sample surface by creating an attractive force [3] between the surface and the tip when it gets closer to the sample surface. When it comes extremely near to make contact with the surface of sample, a repulsive force gradually takes control, causes the cantilever to move away from the surface.
During the deflection of the cantilever away from the sample surface, the direction of reflection of the beam changes, and a laser beam detects the aversion by reflecting off a beam from the cantilever’s flat surface. It detects and records these changes in deflection and direction of the reflected beam using a positive-sensitive photo-diode (PSPD- a component based on silicon PIN diode technology which is used to measure the position of the integral focus of an incoming light signal).
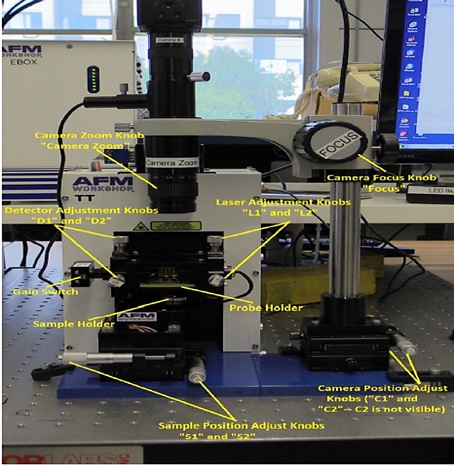
Figure 1: Atomic force microscopy device
AFM has been used to solve problems [4-7] in a variety of natural scientific fields, including molecular engineering, surface chemistry, molecular biology, semiconductor science and technology, polymer chemistry and physics, cell biology, solid state physics and medicine.
The atomic force microscope has numerous advantages as it is suitable for usage in vacuums, liquids and air, it could be used to investigate both living and non-living elements, samples for examination are simple to prepare, it is utilized in dynamic environments, the sample sizes are precisely measured, it can be used to measure surface roughness and it has a 3D imaging system.
The atomic force microscope has some difficulties as detection might cause damage to both the tip and the sample, it can only scan a single 150X150 nm nano-scale image at a time, it has tiny magnification range and a restricted vertical range, and also it has a low scanning duration, which may result in thermal drift on the sample.
Modes of scanning: There are three modes that can be utilized in atomic force microscopy [9-11] such as contact, non-contact, and intermittent contact mode.
Contact mode (Figure 2); indicated the contact mode in atomic force microscopy with a probe-surface separation ˂0.5 nm.
in this situation, the tip never leaves the surface therefore this mode may be utilized for very high resolution imaging , such as imaging of protein crystals displaying protein submits or atomic resolution of inorganic crystals. The maximum vertical force is additionally regulated, allowing the sample’s compression to be restricted. The lateral forces generated by the tip because it travels across the surface. Can be concern in certain instances, but they can also be advantageous in others. The lateral deflection can reveal the friction force between the tip and the sample as well as regions with the same height but differing chemical characteristics.
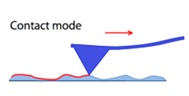
Figure 2: Contact mode in atomic force microscopy
The Non-Contact AFM, (Figure 3) which was first introduced in 1987 [12], has distinct benefits over other modern scanning probe methods like contact AFM and STM. NC AFM can image “soft” materials, since it lacks repulsive forces (which are presented in Contact AFM) and, unlike the STM, it does not need conducting samples.
Shown non-Contact atomic force microscopy with probe-surface separation (0.1-10nm).
The Non-Contact AFM is based on the detection concept of "amplitude modulation." The corresponding detection system takes use of the change in amplitude of a cantilever's oscillation caused by the interaction of a tip with a sample.
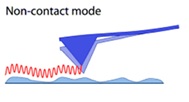
Figure 3: Non- Contact mode in atomic force microscopy
intermittent (tapping mode of AFM) with a probe–surface separation (0.5-2 nm) as the ideal technique to study polymer materials is to use the AFM tapping mode, which uses a vertically oscillating probe to interface with a sample. Because the tip-sample contact is sporadic in this mode, lateral tip-sample force interactions are decreased. Surface profiling is accomplished in the tapping mode by using the cantilever's amplitude damping caused by intermittent tip-sample contact.
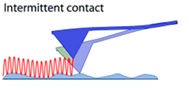
Figure 4: Intermittent (tapping) mode in atomic force microscopy
The height picture depicts the modifications to a sample’s z-position which are required to maintain the interacting probe’s consistent amplitude while scanning. For AFM characterization of soft materials like polymers and biological samples, this approach has indicated to be revolutionary. With the tapping method, a far higher number of polymer samples may be evaluated than with the contact approach. In the tapping mode, however, controlling the tip-sample force interactions is more difficult than in the contact mode [13,14].
Materials and Methods
Reagent and Chemical
All chemicals were analytical reagent and distilled water was used to prepare all the solutions. A standard solution 20 mmol/L of fluconazole (C13H12F2N6O), molecular weight 306.271 g/mol was prepared by dissolving 0.612542 g in 100 ml of distilled water. A stock solution 0.012 mmol/L of Phosphomolybidic acid (H3PMo12O40). 1825.25 g/mol and was prepared by dissolving 5.47575 g in 250 ml of distilled water.
Apparatus
A design of manifold system consists of two lines to determine fluconazole via the use of precipitating agent i.e., phosphomolybdic acid. The specifics of the manifold feed utilized are illustrated in Figure 5. To measure diverged light, a NAG-4SX3-3D analyzer (Homemade equipment) [15] was utilized as a detector. Four-channel peristaltic pump (Ismatec, ISM 796- Switzerland), rotary six port injection valve with Teflon sample loop & Potentiometric recorder (Siemens, Germany) was used to record the output signals. The fluconazole precipitates which were studied using an Atomic Force Microscope (Scanning Probe Microscope) (Type/SPM –AA3000- Angstrom advanced Inc., 2008, United States/A non-contact mode, 0.25 nm Lateral,0.1 nm Vertical/ resolution).
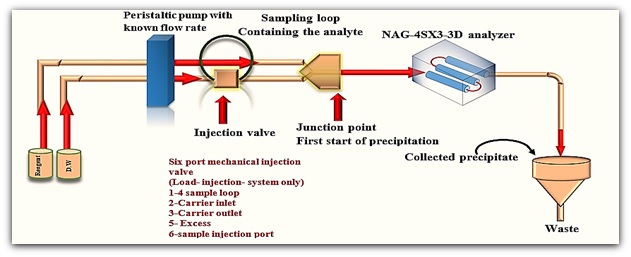
Figure 5: Flow gram of the manifold used in the determination of Fluconazole
Methodology
The production of the precipitate (2-(2,4-difluorophenyl)-1,3-di(1H-1,2-triazol-1-yl)propan-2-yl phosphoric) molybdic anhydride generated by the reaction of Fluconazole with Phosphomolybidic acid (PMA).
The sample is injected (150 µl) with a carrier stream line (first line) at 2 ml. min -1. The solution is driven with two line (carrier stream and reagent stream line) of a reagent by the movement of a peristaltic pump with a specified flow rate (2cmL/min) to a multiple device, as demonstrated in a simplified schematic utilized in this research (Figure 5), where a signal from the source of incident irradiation (i.e., WSLED) is attenuated after the reaction product reaches to the measurement cell (multiple flow cells).
The resulting response is reported using the x-t potentiometric recorder or any other accessible reading device. Multiple different prototypes were used in this study, several factors were offered to help reach a satisfactory result, and all outcomes were reviewed in a consolidated manner.
As displayed in Figure 5, a precipitate is formed from the reactant Fluconazole with phosphomolybidic acid during the following reaction product and the samples collection for analysis is the first step in the AFM research process. Sampling is crucial because it represents the basic concept of the type of precipitate that forms. The precipitate is collected while the scatter plot is running, releasing precipitate with varying grain characteristics due to the changing concentration, which accurately represents the entire properties of the precipitate generated.
Low, medium, and high concentrations represent the various stages of precipitate formation and crystal development, depending on the type of the created precipitate. The analyte precipitate is washed with distilled water to eliminate any excess reagent required to finish the reaction and generate the analyte precipitate.
Extra reagent and other mother liquid chemicals required for sampling and washing of produced precipitate on the funnel are rinsed out of the funnel in both circumstances. After drying, the filter paper is carefully sealed overnight to prevent grit. The sample is ready for atomic force microscopy outline inspection. Because of the separate populations, AFM did not assess the reactant of the predicted reaction and hence, it cannot be associated with the precipitate as fineness, i.e. the grain size would be completely different from the precipitate acquired as a result of the development policy. The effect of tip-sample contact on the scanned surface of the shaped precipitate is illustrated in Figure 6, in which the depth that seen by the probe = 13.58 nm and seen the probe = 48.44 nm.
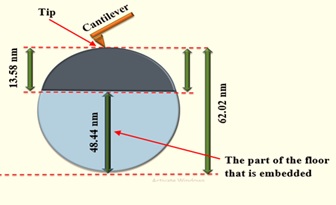
Figure 6: A comparing of the probe scan and the apparent granules height
AFM provided the Granularity accumulation distribution report, which included the grain number (306), average diameter (62.02), and variation percentages of 10%, 50%, and 90% of a variable diameter.
For the distribution of grain diameter, a histogram graphic is also provided. A mathematical treatment of data using data smoothing [16,17] and Savitzky-Golay [18,19] via second curve fit (usually 35 %, sometimes more, is required and may reach 75 % to determine whether crystal growth is going to large particle formation or too small particle formation, or whether the distribution is Gaussian [20].
Results and Discussion
The AFM idea is discussed the terms of both surface morphology and surface growth. The total Scan area by probe (nm2) is 1537 nm x 1537 nm = 2362369 nm2 and the grain No. of particles: 306 granules and Avg. Diameter 62.02 nm are depicted in Table 1, in which the number of granules is explained for each volume %, this data represented by granularity distribution as shown in Figure 7-A and smoothing of data at 35 % (Figure 7–B), Savitzky-Golay between volume (%), and diameter of grains as displayed in Figure 7-C.
Table 2 and Figure 8 summarize the diameter variation, the number of grain vs. volume and granularity accumulation, and distribution data collected for the reaction between fluconazole and PMA.
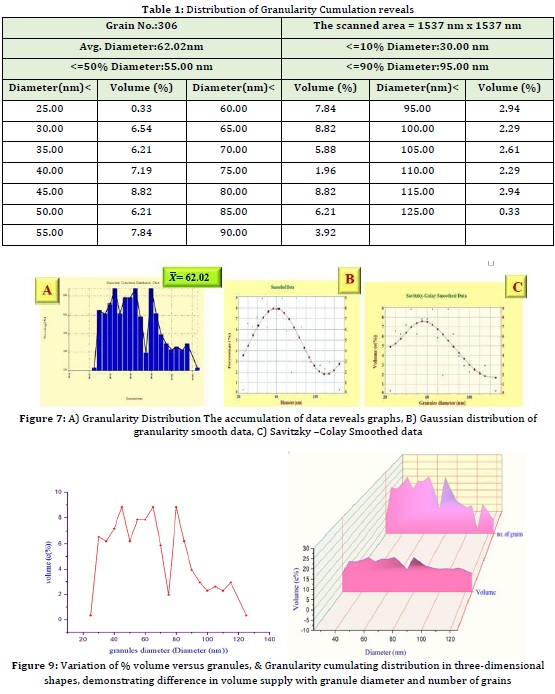
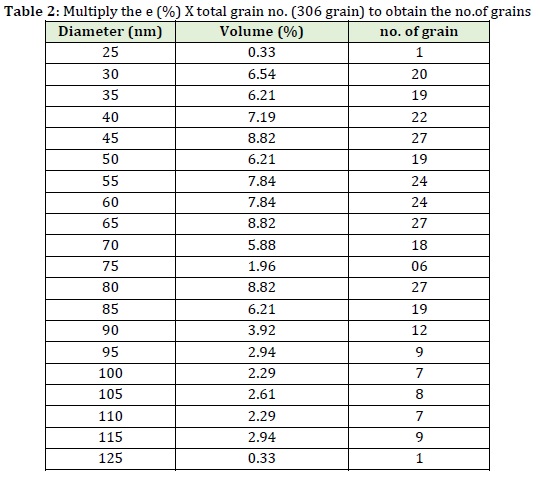
Table 2 indicates the number of grains for the reaction of PMA with fluconazole and there are 20 variables (availability %) of granules of different diameter. It is possible that find out the number of each diameter based on the multiplied the total number of grains by % of 50%, 10%, and 90%, and also divided by the total percentage.
Based on the given availability we have: < = 50%, < = 10% and < = 90%
Multiply % X total grain no / 150
306 = 102 grains
306 = 20.4 grains
306 = 183.6 grains
Surface Roughness Analysis: To apply the proposed methodology, a series of equations were applied using all the roughness surface analysis parameters. This approach allows conducting a useful calculation including the total surface area of the sample, the surface area occupied by the nanoparticles, the number of nanoparticles, the empty area, the number of nanoparticles which can occupy the empty area (theoretically), and concentration of the presentation nanoparticles.
The following is the calculation for surface contour estimate using AFM:
Dimension s 1537 nm × 1537 nm = 2362369 nm2
= 4π r2
= 4 × 3.14 × ( nm) 2 = 12077.94846 nm2
= 306 × 12077.94846 nm2
= 3695852.228 nm2
Scanned surface area - Total surface area of all granules
2362369 nm2 - 3695852.228 nm2 → -1333483.22 nm2
-1333483.22 nm2 12077.94846 nm2 =110.406 granules
This number means the extra granules above the 1st ground monolayer
Total no. of grain – formed extra granules
306 – 110.406 → 195.594 grains
The area that each granule will occupy a piece of space in the 1st ground monolayer is
Section area (scanned by the probe) no.of grain in the 1st layer is
2362369 nm2 195.594 (≅196) → 12052.903 nm2 occupied surface area of the lower
The remained granules no. = 110.406 granules =110 granules
Extra area = -1333483.22
Sidewalk/110 → →
The (-) ve sign will be neglected 12122.5747 nm2
We are dealing now with
1st monolayer 12052.903 = 12053 nm2 1st ground monolayer
Sidewalk 12122.5747 = 12123 nm2 2nd monolayer the walk only
12123>12053
Different 70 nm2
Two numbers of granules are a variable
1st granules monolayer = 196 granules
Base on Avogadro numbers 6.02 1023 (concentration can be found)
10-23 1mole =3.255 10-22
2nd monolayer (extra area = sidewalk)
10-23 1 (mole) =1.827243 10-22
Each granule will carry a core of
Total concentration/ no, of grains
3,2558 10-22 / 196 = 1.661129 10-24 mole
For the 2nd layer (sidewalk)
1,827243 × 10-22 =1.661129 × 10⁻²⁴ mole
Therefore, the image surface roughness analysis of precipitate produced in flow injection analysis via atomic force microscopy is displayed in Figure (10 A and B). Figure 11 illustrates the multilayer which attracts the fallen nanoparticles and the results are summarized in table (3).
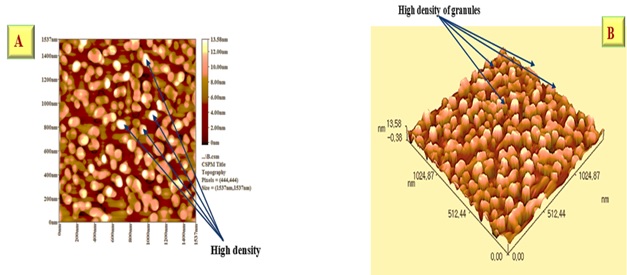
Figure 10: Analysis by AFM topographical describing A) 2D & B) 3D showing the depth of surface roughness for the reaction Fluconazole with phosphomolybdic acid to form bale yellow precipitate
Amplitude parameter: Roughness average of 2.79 nm seems to be low value because the depth of scanned section does not go beyond 13.58 nm. The peak – peak value equals to 14 nm, while 10 point height is just about the same it is value is 13.9 nm. It means the probe was not able to recognize between 2 height and 5 height due to compactness, so the peak height = 2.78 nm, as illustrated in Figure 12.
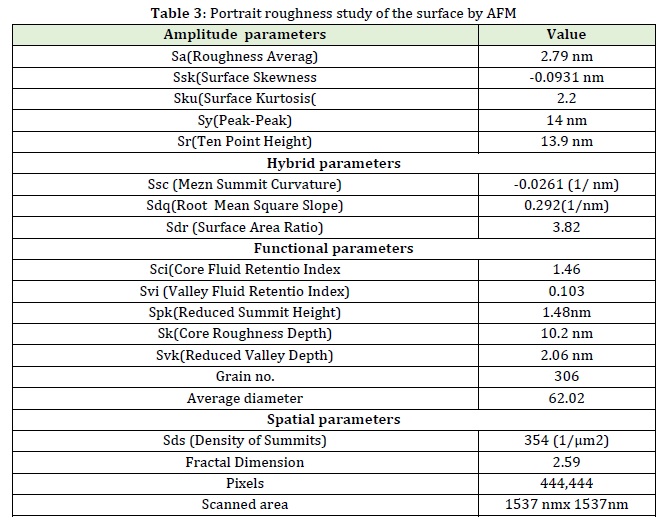
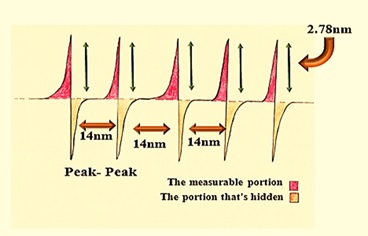
Figure 12: Indicates how the peak to peak and ten-point height characteristics generated from AFM data may be show
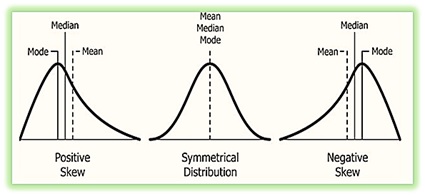
Figure 13: The types of Skewness: Positive Skewness has a longer tail in the right side of the distribution and mean and median are greater than the mode, while negative Skewness has a longer tail in the left side of the distribution and also, mean and median are less than the mode
Kurtosis is another important surface roughness parameter which indicates the presence of deep valleys (ku <3.00) or high peaks (ku>3.00). Therefore, measurements of Kurtosis can be useful for indicating the presence of either valley or peak defects which may occur on a surface. The surface kurtosis illustrates a value of 2.2 which mean that it is within the meso kurtosis and plat kurtosis with a lot of outside values and they are less than 3 (Sku<3.00) which indicate that the nanoparticles surfaces are gradually varying from the peaks to the valleys and there are no inordinately high peaks or deep valleys.
Hybrid parameters: The root mean square in the hybrid parameter can also be useful in measuring the angles which the probe has taken during scanning the surface of samples. The angles represent the slope of the line from the depth surface area of the grains to the highest point at the grains’ surface. These angles are calculated by taking the inverse tangent of the root mean squares of the grains.
Root mean square slope = 0.292 [1/nm], the low slope value indicate that grain height is low.
Functional parameters of surface roughness, another two factors need to be taken into considerations which are core fluid retention index and valley fluid retention index. The core fluid index has a value = 1.46 and the valley fluid index has 0.103. These two factors are determined the liquid phase in the surface of the grains. For the core fluid index, it determines the void volume on the core of peak, therefore, value more than 1.36 indicates the large void volume on the core than the valley fluid which has the void volume in the deep valley less than core, due to the high concentration used or long sample volume (narrow loop tube diameter which makes large path for the sample to move) through buildup of grains Figure 14.
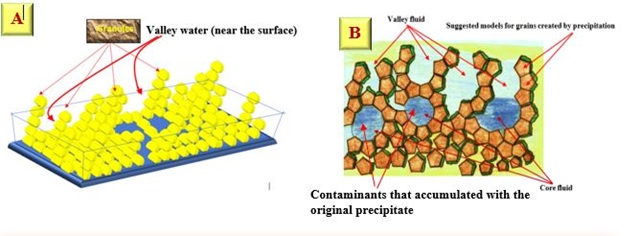
Figure 14: A & B: A hypothetical shape which represents how a mature precipitates valley and core are formed
Since, the core fluid retention index is 1.46, while valley fluid retention index is 0.103.
Therefore, = 14.17 ≅ times.
There is water ≅14 times in the core relative to what is available at the valley, indicating a fast growth of nuclei followed by crystal growth which will trap the water at core leaving the outer surface as a valley that contains 14 times less water. It is expected due to the surface exposure to atmospheric variation of air and warmness.
Surface bearing index =1.66 indicates that an additional layer of granules exists, as displayed in Figure 15.
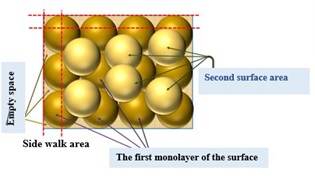
Figure 15: 3D model of a mono ground layer (brown) with the creation of a second monolayer is seen (bale yellow)
|
Valley fluid |
|
Core fluid |
|
Suggested models for grains created by precipitation |
Spatial parameter; density of summits = 354(1/ μm2) which explains the large number of grains of average small size of 62.02 nm as an average Φ all particles (granules) 10%, 50%, and 90% are with nano level as they are less than 100 nm. Here, the definition of nano level is applied.
Fractal dimension; 2.59 indicate, the scanned fractions of total scanned area dimensions Pixels=444,444 indicate the number of lightening spots (Figure 16 and 17)
Figure 16: Explanation of Fractal Dimension
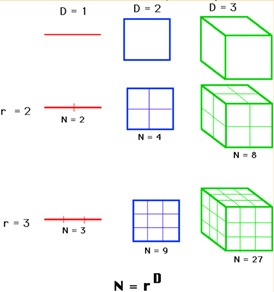
Figure 17: Explanation of calculation of fractal analysis of surface roughness
Conclusion
CFA and AFM were used to investigate the precipitate particles formed by the reaction of fluconazole with phosphomolybdic acid, which resulting a pale yellow precipitate.
As we have observed, when the area of the scanned surface by AFM is subtracted from the total surface area of the granules, the results are either positive or negative, if the results of the subtraction are positive, it means that there is still room for more granules to form, because the concentration of newly formed granules would fill the first ground monolayers; this could only happen at low reactant concentrations, i.e. in the lower section of the scatter plot.
If the data (subtraction values) are negative, it simply signifies that no space will be available at the first ground monolayer.
Monolayers lead to the formation of a new second monolayer. It may occur at the average X and (Y), i.e., the centroid value of the scatter plot of X (analyte concentration) vs. the obtained response (Y), which is supposed to correlate with the average developed precipitate (formed granules), just at this point, due to the abundance of additional granules which cover up the second ground monolayer (or even portion of its surface area).
Hence, the results of this study suggest that there is a lot of potential in utilizing the profound topography of the targeted precipitate created and its properties to verify a future effort in nanotechnology.
Acknowledgments
I’d like to convey my heartfelt gratitude to Prof. Issam Mohammad Ali Shakir for providing me with the amazing chance to conduct this research and for assisting me in its completion.
Funding
This research did not receive any specific grant from fundig agencies in the public, commercial, or not-for-profit sectors.
Authors' contributions
All authors contributed toward data analysis, drafting and revising the paper and agreed to responsible for all the aspects of this work.
Conflict of Interest
We have no conflicts of interest to disclose.
ORCID:
Sarah Faris Hameed
https://www.orcid.org/0000-0002-7607-3498
HOW TO CITE THIS ARTICLE
Sarah Faris Hameed, D. Nagham Shakir Turkie. A Novel Approach for Study of Surface Morphology & Roughness Analysis for Characterization of Precipitation Product at A Nanoscale Level via the Reaction of Fluconazole with Phosphomolybidic Acid. Chem. Methodol., 2022, 6(5) 385-397

| Article View | 1,287 |
| PDF Download | 396 |