Document Type : Original Article
Authors
Department of Chemistry, College of Science for Women, University of Baghdad, Baghdad, Iraq
Abstract
4-Amino-N-(5-methyl-isaxazol-3-yl)-benzenesulfonamide, a new azo (LH) ligand, was synthesized by reacting the diazonium salt of Sulfamethoxazole with coupling compound 3-amino phenol. Spectroscopic techniques (UV-Vis, FTIR, 1H &13C-NMR, and LC-Mass) as well as micro elemental analyses (C.H.N.O) and TGA and SDC were used to identify the azo ligand. Complexes of (Zn(II), Cr(III), Cu(II) and VO(II)) were produced and characterized by atomic absorption, elemental microanalysis, infrared, LC-Mass, TGA, DSC and UV-Vis spectral techniques, as well as conductivity and magnetic quantifications. All the complexes had a 1:2 metal-ligand ratio, and non-electrolytes at all complexes and tetrahedral geometry suggested except Cr-complex, which demonstrated octahedral and VO-complex that demonstrated Square pyramidal. The results of the thermal decomposition indicated the presence of coordinated water molecule for only Cr-complex. The biological activity of some prepared compounds against two types of bacteria and four types of fungi was also studied, suggesting varying inhibition values.
Graphical Abstract
)
Keywords
Main Subjects
Introduction
Azo entities demonstrate the wider incoming commercial dyes. It is believed that the benefit of such compounds is on the rise. Additionally, they occupy a main role that controls the azo-dyes and printing materials. These dyes result from simple means including diazotization-coupling. Various modifications were carried out in order to gain desirable-colored features [1]. Azo-dyes are widely employed dyes constituting approximately 60% of whole dyes [2,3]; 70% of all dyes applied in manufacturing are azo entities [4,5], which are distinguished by their N=N functional group [6]. Azo dyes are the most important synthetic colorants that have been widely used in textile, printing, paper manufacturing, etc. [7]. Azo entities have also been employed in textile. In addition to their harmful aspects that affect human beings, they have attracted attention for treating liquid wastes containing azo dyes in order to destroy them or convert them into useful products [8,9]. Azo compounds can be synthesized in many ways: Diazotization and coupling [10], condensation of nitro compounds with amines [2], reduction of nitro compounds [3], and oxidation of amino compounds [4]. Industrially, diazotization and azo coupling reaction are the preferred chemical routes unless the desired starting raw materials are unavailable. In the absence of the starting materials for diazotization and azo coupling, other chemical routes can be used. In this work, we have also synthesized our ligand according to diazotization and coupling method. In such reactions, strong mineral acids like H2SO4 and HCl in aqueous solution have been the most prevalent method to synthesize azo aromatic compounds via diazotization-azo coupling reactions [10-12]. Using mineral acids in diazotization reactions clashes with the concept of green chemistry. 3-aminophenol and sulfamethaxazol as starting materials forming (E)-3-((4-amino-2-hydroxyphenyl)diazenyl)-N-(4-methylisoxazol-3-yl)benzenesulfonamide can be classified as azo compound, which in turn coordinate with each of VO(II), Cu(II), Zn(II) and Cr(III) metal ions in 2:1 ratio.
Materials and Methods
The next chemical materials were obtainable trading products, Sulfamethoxazole, 3-aminophenol, hydrated sodium nitrate NaNO3, hydrochloric acid HCl, ethanol, metal salts (VOSO4.5H2O), (CrCl3.6H2O), (ZnCl2) and (CuCl2), gained from F-897ewluka, sigma Aldrich. FTIR was detected in the range of 4000-400 cm-1 on a Shimadzu-3800 Spectro-meter. The electronic spectral data were detected by using Shimadzu160 Spectro-photometer. Mass indication analysis of compounds was carried out by LC Mass100P Shimadzu. TGA investigations of all previous forms were done on Perkin-Elmer Pyris Diamond DS/TGA. 1H-NMR spectra were registered by employing Bruker 400-MHz Spectro-meter and elemental micro analysis was done on a Perkin-Elmer automatic instruments model 240B. Metals were estimated employing a Shimadzu(A-A)680G AA-spectrometer. Accessibility was measured by employing jenway4071. The chloride content was estimated gravimetrically. Magnetic features were measured using balance magnetic susceptibility model MSR-MKi.
Synthesis of azo dye ligand
The ligand in Scheme 1. was synthesized according to the suggested method by Shibata [13]. 1g, 3.948 mmol of Sulfamethoxazole was dissolved in a mixture composed of 37% (2 mL) concentrated Hydrochloric acid HCl, (15 mL) distilled water and 15 mL of ethanol. The solution was cooled from 0 °C up to 5 °C, then 10%, 1g, 14.49 mmol of hydrated Sodium Nitrite NaNO2 was gradually added to the solution with continuous stirring to avoid any increase in temperature up to 5 °C, followed by leaving the solution for about 45 min. to perform the diazotization process resulting in diazonium salt; salt solution was added gradually with continuous stirring onto (0.43 g, 3.948 mmol) of 3-aminophenol dissolved in 20ml of ethanol. The change in solution into dark color was observed by keeping on stirring for about 30 min. to perform the reaction. The solution was isolated until being stable, then a few drops of sodium hydroxide was added to NaOH solution in order to equivalize the middle of reaction till reaching 6.8pH at which the perfect precipitating of ligand occurred. Finally, the former was filtered and recrystallization was made by methanol and dried, resulting in 1.34 g, 90.70%, m.p, 192-194 °C and orange precipitate.

Scheme 1: Synthesis of ligand
General method for the preparation of metallic ions complexes
The metal ion complexes were made by employing their corresponded metal salts as follows: 0.00027 mol, 1 g of azo ligand dissolved in 20 mL of absolute ethanol (with continuous stirring) was gradually added dropwise to Zn(II), VO(II), Cr(II) and Cu(II) (0180 g, 0.00133 mol ZnCl2 and 0.240 g VOSO4.5H2O), (0.352 g CrCl3.6H2O), (0.178 g CuCl2), meant to equalize 0.00133mol. Each metal salt was used in [1:2] M:L form. The mixture was heated for 2 hours at 50-70 °C, then chilled in an ice bath until precipitated, then left overnight. To remove any unreacted components, the solid complexes were separated and washed with distilled water and a little amount of hot ethanol. Finally, vacuum desiccators were used to dry the complexes (Scheme 2). The analytical and physical properties of the ligand and its metal complexes are summarized in Table 1.
Study of Bioactivity
Some of the starting materials (ligand and employed-metal-salts) were examined for staphylococcus aureus (gram positive) and Pseudomonas aeruginosa (gram negative) bacteria and fungi such as Penicilliumexpansum, Fusariumgraminearum, Macrophominaphasealina, and Candida albicans through wall-agar-distribution-manner. The employed solvent was DMSO. The concentrations of the materials mentioned previously was 10-3 M. The tablets were evolved for 24 and 48 h pertaining to bacteria and fungi, respectively, at 37 °C.

Scheme 2: Synthesis of complexes
Table 1: Physical features and analytical returns of ligand and its related complexes
|
Compounds formula |
Micro elemental analysis (Found) and Calc. |
%M |
%Cl |
Color |
m.p (°C) |
Yield (%) |
||||
|
%C |
%H |
%N |
%O |
%S |
||||||
|
C16H15N5O4S 373.39 g/mol |
(52.44) 51.47 |
(4.99) 4.05 |
(19.01) 18.76 |
(16.16) 17.14 |
(7.40) 8.59 |
-- -- |
-- -- |
Orange |
192-194 |
90.97 |
|
C32H28N10O9S2V 811.70 g/mol |
(46.64) 47.35 |
(4.44) 3.48 |
(18.71) 17.26 |
(17.99) 17.74 |
(8.07) 7.90 |
(6.5) 6.28 |
-- -- |
Dark Brown |
209d |
78 |
|
C32H30N10CrO9S2Cl 850.22 g/mol |
(46.04) 45.20 |
(4.03) 3.56 |
(17.01) 16.47 |
(16.81) 16.94 |
(7.79) 7.45 |
(6.95) 6.12 |
(3.88) 4.17 |
Olive |
230-233 |
75 |
|
C32H28N10O8CuS2 808.31 g/mol |
(48.19) 47.55 |
(2.98) 3.49 |
(18.78) 17.33 |
(16.11) 15.83 |
(9.07) 7.93 |
(8.45) 7.86 |
-- -- |
Reddish Brown |
288d |
90 |
|
C32H28N10O8S2Zn 810.15 g/mol |
(46.74) 47.44 |
(4.41) 3.48 |
(16.61) 17.29 |
(14.64) 15.80 |
(8.71) 7.92 |
(8.88) 8.07 |
-- -- |
Light Brown |
>325 |
89 |
d = decompose
Result and discussion
Physical and chemical properties of azo dye ligand
Azo-ligand distinguished by its non- crystalline appearance resembled high quality orange-powder, which is soluble in DMF and DMSO but it is highly soluble in ethanol. In presence of air, azo complexes and related azo bond are stable.
(1H and 13C)-NMR spectra
Figure 1 shows the 1H-NMR spectra of the ligand LH in DMSO-d6. The spectra revealed a peak at δ (2.51) ppm, which was ascribed to CH3 chemical changes; at 5.94 ppm, the NH2 group appears as a singlet. The proton (OH) phenolic ring was ascribed to the highest signal at (11.14) ppm. The aromatic protons of benzene groups are attributed to the numerous peaks at δ (7.78-7.80) ppm. The proton (NH) was ascribed to the highest signal at (9.51) ppm. The proton (C-H aromatic) of the besides phenol group Ar-OH is responsible for the singlet signal at δ (6.75) ppm and (C-H aromatic) of the besides phenol group Ar-NH2 is responsible for the singlet doublet at δ (6.87) ppm. The proton (C-H aromatic) of the besides CH3 group heterocyclic is responsible for the singlet signal at δ (5.49) ppm [14-16]. The molecular structure is illustrated as follows: 13C-NMR (DMSO, ppm): 15.16(C-1), 174.60(C-2), 107.50(C-3), 167.70(C-4), 162.15(C-5), 131.97(C-6 C-7), 132.02(C-8), 146.94(C-9), 148.76(C-10), 157.27(C-11), 134.31(C-12), 115.39(C-13), 121.95(C-14), 151.10(C-15), 153.24(C-16).
1H-MNR spectrum of zinc complex in Figure 2 demonstrates a singlet signal belonging to (N-H) group 2H at δ 8.55 ppm, multiplate signal at 8.01-7.58 ppm belonging to 8H of aromatic C-H group, singlet signal belonging to aromatic 2H of C-H group being close to phenolic group at δ 6.71 ppm, doublet signal belonging to 4H of aromatic ring C-H being close to primary amine group at δ 6.94 ppm, singlet signal belonging to 4H of primary amine (Ar-NH2) at δ 5.52 ppm, another singlet signal belonging to 2H of C-H group present in hetero ring at δ 5.25 ppm, and singlet signal belonging to 6H of terminal CH3 group at δ 2.61 ppm in addition to the presence of solvent signal at δ 2.51 ppm. The disappearance of phenolic group OH signal and presence of NH2 signal is some evidence indicating the occurrence of coordination through phenolic oxygen and that the primary amine group does not coordinate with metal ion [14].

Figure 1:1H &13C-NMR spectra of ligand

Figure 2: 1HNMR spectra of Zn-complex
Electronic spectra measurements
Table 2 and Figure 3 show the electronic spectrum of ligand (LH). Vanadium complex demonstrates two electronic transitions at 261 and 440 nm in ultra violet region belonging to π→π* and n π→*, respectively, in addition to the two electronic transitions observed at 642 and 687 nm that are attributed to 2B2g→2Eg and 2B2g →2B1g electronic transitions, whereas the electronic spectrum of copper complex in Figure 4 demonstrates the next electronic transitions, 270 nm, 448 nm and 788nm related to π→π*, n→π* and 2T2→2E, respectively, and the zinc electronic spectrum which in turn demonstrates the following electronic transitions: π→π* at 268 nm , n→π* 448 nm and C.T (M→L). In conclusion, along with the electronic spectrum of chromium complex, we also demonstrated the following transitions: In UV-region at 266nm and 442 nm related to π→π* and n→π* transitions, respectively, and C.T transition which proves the occurrence of coordination with ligand in addition to presence of three bands in vis-region at 700 nm, 804 nm and 900 nm belonging to 4A2g→4T1g(P), 4A2g→4T1g(F) and 4A2g→4T2g(F), respectively. The previous electronic data indicate the following geometries: Tetrahedral for both Cr and zinc complexes and square pyramidal, and octahedral geometries for each of VO and Cr complexes, respectively [15-17].

Figure 3: UV-Vis of ligand HL

Figure 4: UV-Vis of Cu-complex
Table 2: Electronic spectral data of the metal complexes with LH ligand and molar conductivity in DMSO (1×10⁻³ M)
|
Compounds |
λ nm |
ύ cm-1 |
Abs |
Ɛmax |
Transition |
Geometry |
Ʌm (S.cm2.Mol-1) |
|
Ligand=LH |
258 435 |
38759.6 22988.5 |
1.182 2.571 |
1182 2571 |
π→π* n π→* |
-- |
|
|
[VO(L)2] |
261 440 642 687 |
38314.1 22727.2 15576.3 14556 |
1.183 2.580 0.200 0.170 |
1183 2580 200 170 |
π→π* n π→* 2B2g2→Eg 2B2g → 2B1g |
Square Pyramidal |
23 |
|
[Cr(L)2(H2O)Cl] |
266 442 700 804 900 |
37594 22624.4 14285.7 12437.8 11111.1 |
0.551 0.612 0.050 0.077 0.045 |
551 612 50 77 45 |
π→π* n→π* 4A2g→4T1g(P) 4A2g→4T1g(F) 4A2g→4T2g(F) |
Octahedral |
21 |
|
[Cu (L)₂] |
270 448 788 |
37037 22321.4 12690.3 |
1.012 1.135 0.095 |
1012 1135 95 |
π→π* n→π* 2T2→2E |
Tetrahedral |
22 |
|
[Zn (L)2] |
268 448 |
37313.4 22321.4 |
1.448 1.887 |
1448 1887 |
π→π* , n→π* C.T (M→L) |
Tetrahedral |
25 |
Liquid chromatography–mass spectrometry (LC–MS) measurements
The electron impact of fragmentation was used to acquire mass spectra of the novel ligand and metal complexes. High-resolution MS of the free azo ligand and its complexes, as well as large fragments linked to breakdown products, was obtained in general [18]. Figure 5 shows the electron impact mass spectrum of ligand LH. This ligand molecular weight was calculated to be 373.39g/mol. The spectra showed a peak at 373 m/z, which was attributed to [M]+ and corresponded to a novel azo moiety C16H15N5O4S. Other distinctive peaks at 239, 141,136 and 97 m/z might be attributed to other pieces. Their brightness indicated the stability of the pieces. Figure-6 depicts the mass spectrum of the VO(II) complex. The complex moiety C32H28N10O9C2V had a peak at 811 m/z, which corresponded to the complex moiety C32H28N10O9C2V in the spectrum. Other distinctive peaks at 359, 356 and 97 m/z might be attributed to other pieces. Figure 7 depicts the mass spectrum of the Cr(III) complex. The compound moiety C32H30N10CrO9S2Cl was identified by a peak at 850 m/z in the spectra. Other distinctive peaks at 477, 237and 136 m/z might be attributed to other pieces. Figure 8 depicts the electron impact mass spectrum of the Cu (II) complex. The complex moiety C32H28CuN10O8S2 was identified by a peak at 808 m/z in the spectra. Other distinctive peaks at 663, 372, 275 and 161 m/z might be attributed to other pieces. [18-21]. Schemes 3–6 demonstrate the suggest fragmentation routes and structural assignments of pieces.

Figure 5: Mass spectrum of ligand (HL)

Figure 6: Mass spectrum of vanadium complex

Figure 7: Mass spectrum of chromium complex

Figure 8: Mass spectrum of copper complex

Scheme 3: The fragmentation pattern of ligand (LH)

Scheme 4: The fragmentation pattern of VO-complex

Scheme 5: The fragmentation pattern of Cr-complex

Scheme 6: The fragmentation pattern of Cu-complex
Infrared spectra measurements
FT-IR spectrum of the resulting ligand demonstrates new distinguishable double bands at 1406 and 1467 cm-1 attributed to stretching vibrational behavior of azo group N=N, which indicates the ligand formation. On the other hand, the FT-IR spectra of VO(II), Zn(II), Cu(II) and Cr(III) complexes recorded the disappearance of stretching vibrational behavior O-H phenolic group compared with the presence of such vibrational mode in free ligand, proving the occurrence of coordination through phenolic oxygen. Other indications that prove the occurrence of coordination include the observation of new vibrational modes of M-O, M-N and V=O groups at (569-416), (686-447) cm-1 and 891 cm-1, respectively, the change in shape, intensity and position of N=N mode compared with the mode of such group in free ligand by 38-58 cm-1. Additionally, the observation of stretching vibrational behavior at 3742, 1579 and 762 belong to the coordinated water molecule with chromium ion [22-28]. All the Fourier transfer returns are listed in Table 3 below.
Table 3: FT-IR returns of ligand and its complexes
|
Other bands |
(H2O) |
M-N |
(M-O) |
SO2 |
N=N |
(C-H)ν aliphatic |
ν(C-H) aromatic |
ν(NH) |
ν(NH2) |
Compound |
|
(OH) phenolic 3492 |
|
-- |
-- |
1035 1091 |
1467 1406 |
2927 |
3042 |
3142 |
3377 3318 1618 |
Ligand |
|
(V=O) 891 |
|
536 |
416 |
1045 1086 |
1461 1436 |
2927 |
3009 |
3189 |
3323 3284 1624 |
[VO(L)2] |
|
- |
3742 1579 762 |
595 |
525 |
1039 1110 |
1451 1410 |
2923 |
3079 |
3285 |
3458 3379 1625 |
[Cr(L)2(H2O)Cl] |
|
- |
- |
537 |
416 |
1042 1089 |
1409 1435 |
2927 2849 |
3027 |
3197 |
- |
[Cu(L)2] |
|
- |
- |
509 |
411 |
1044 1088 |
1400 1433 |
2954 2888 |
3055 |
3200 |
- |
[Zn(L)2] |
Study of thermo gravimetric analysis for the compounds by TGA and DSC Curve
The results of thermogravimetric analyses and DSC of azo and its complexes are given in Tables 4 and 5 and Figures 9–16. The thermograms were performed in the range of 30–700C at a heating rate of 10 °C/min in nitrogen atmosphere. They displayed an agreement in weight loss between their consequences achieved from the thermal decomposition and the considered values, supporting the results of elemental analysis and confirming the proposed formulae [29–33] as shown in Scheme 7. The prepared compounds showed a decomposition of the compounds in the thermo gravimetric decomposition curve, where the ligand showed little thermal stability at 41 °C, similar to the little stability complexes in the range of 150 °C for Cr complex, indicating the presence of water molecules in the Cr complex, either water hydrate or Aqua. Finally, the pyrolysis steps of the ligand LH and its complexes were determined and predicted the steps that involved the amount of the released and absorbed energy in DSC curve.
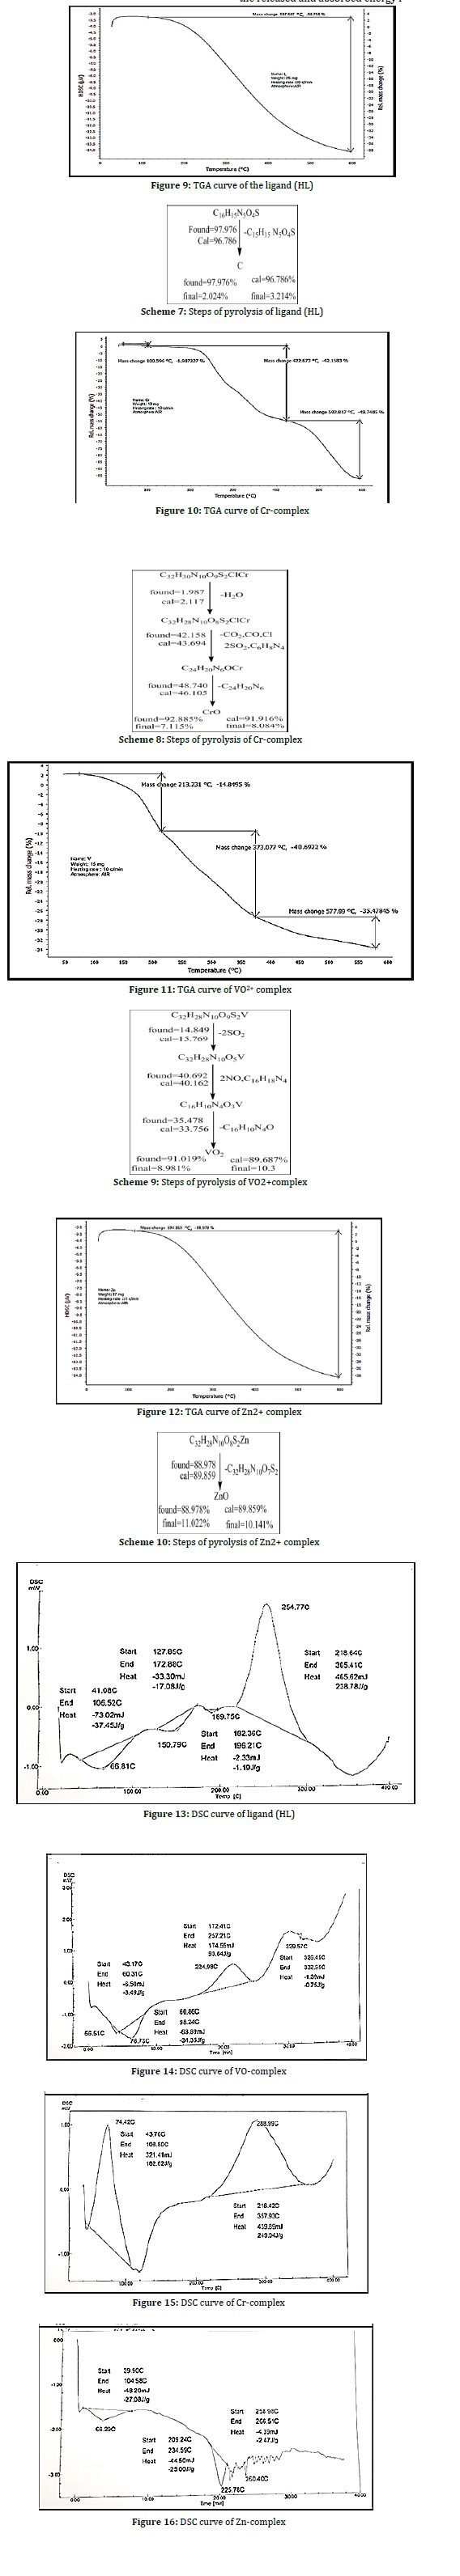
Table 4: DSC data of the ligand and its complexes
|
Compound |
°C/Ti |
Tf/°C |
Maximum temperature point °C |
Type |
ΔH J/g |
|
Ligand HL |
41.08 127.85 182.36 218.64 |
106.52 172.88 196.21 305.41 |
66.81 150.79 189.75 254.77 |
endothermic endothermic endothermic exothermic |
-37.45 -17.08 -1.19 238.78 |
|
[VO(L)2] |
43.17 60.86 172.41 326.45 |
60.31 98.24 257.21 332.99 |
56.51 76.73 224.98 329.57 |
endothermic endothermic exothermic endothermic |
-3.49 -34.35 93.84 -0.75 |
|
[Cr(L)2(H2O)Cl] |
43.76 218.42 |
108.80 357.93 |
74.42 288.929 |
exothermic exothermic |
182.6 244.94 |
|
[Zn(L)2] |
39.90 209.24 258.98 |
104.58 234.59 266.51 |
66.29 225.78 260.40 |
endothermic endothermic endothermic |
-27.08 -25.00 -2.47 |
Table 5: TGA records for the ligand and its related complexes
|
Compound |
Ti / °C |
Tf/ °C |
TDTG max |
% Estimated (calculated) |
(Remnant) Remnant |
Assignment
|
|
|
Mass loss |
Total mass loss |
||||||
|
(HL) |
119.634 |
597.547 |
306.763 |
97.976 (96.786) 2.024 (3.214) |
97.976 (96.786) |
|
-C15H15N5O4S C |
|
[VO(L)2] |
79.136 213.231 373.077 |
213.231 373.077 577.89 |
166.397 279.264 471.357 |
4.89 (15.769) 40.692(40.162) 35.478(33.756)
|
91.06 (89.687)
|
8.94 (10.313) |
-2SO2 -2NO,C16H18N4 -C16H10N4O VO2 |
|
[Cr(L)2(H2O)Cl] |
43.344 100.596 422.673 |
100.596 422.673 592.817 |
80.864 377.796 517.782 |
1.987 (2.117) 42.158 (43.158) 48.740 (46.105) |
92.885 (91.38) |
7.115 (8.62) |
-H2O CO2,CO,Cl,2SO2 C6H8N4 -C24H20N6 CrO |
|
[Zn(L)2] |
119.36 |
594.869 |
348.85 |
88.978 (89.859) |
88.978 (89.859) |
11.022 (10.141) |
-C32H28N10O7S2 ZnO |
Vital diagnosis
The vita vigor of azo entities and their related-compounds including S aureus, P aeruginosa Bacteria and Fungi P expansum, F graminearum, M phasealina, and C albicans bacteria was examined. The incoming returns were recorded in schedule-6 below and compared with DMSO. Azo entity demonstrates observational-inhibitions, either at high concentrations-A or at low concentrations-B. There were variations recorded at each of the concentrations employed [34-36].
Table 6: Vital returns
|
Compounds |
Positive and negative bacteria |
Fungi |
||||||||||
|
type |
S.T |
P.A |
Pe. |
F.M |
M.P |
Ca.a |
||||||
|
Conc. |
A |
B |
A |
B |
A |
B |
A |
B |
A |
B |
A |
B |
|
CrCl3.6H2O |
15 |
12 |
16 |
15 |
38 |
28 |
38 |
33 |
ــــــــ |
ــــــــ |
ـــــــ |
ـــــ |
|
LH |
12 |
ـــــــ |
12 |
ـــــــ |
ـــــــ |
ـــــــ |
ـــــــ |
ـــــ |
ــــــــ |
ــــــــ |
ـــــــ |
ـــــ |
|
[Cr(L)2(H2O)Cl] |
16 |
ـــــــ |
15 |
ـــــــ |
20 |
18 |
28 |
22 |
24 |
16 |
ــــــ |
ـــــ |
|
ZnCl2 |
40 |
25 |
23 |
18 |
30 |
18 |
26 |
15 |
0 |
0 |
20 |
10 |
|
[Zn(L)2] |
20 |
0 |
15 |
0 |
13 |
0 |
0 |
0 |
25 |
16 |
0 |
0 |
|
Control |
0 |
0 |
0 |
0 |
0 |
0 |
0 |
0 |
0 |
0 |
0 |
0 |
S.T =Staphylococcus aureus, P.A.= Pseudomonas aeruginosa, Pe.=Penicilliumexpansum, M.P= Macrophominaphaseolina and Candida albicans =Ca.a, A= conc. B= dilute.

Study of complexes in gas stat (theoretical studies)
Electrostatic potentials
Theoretical study for the formed entity (LH) was accomplished at its gaseous state in order to detect the stretching vibrations and Fourier transform spectra and make a competition for them with the practical returns, as well as to detect the mistake percentage, and so forth for the complexes [37].

Figure 19: Electrostatic potential (HOMO and LUMO) as 2D and 3D contours for LH
Optimal energies
Hyper Chem 8 was employed in mech. calculations resembling theoretical (ΔHf°) and (ΔEb) for each synthesized entity as represented in Table in 7.
Table 7: Conformation energetic (in KJ.mol-1) for Naringin and its metal complexes
|
Compound |
∆H°f Heat of formation |
∆Eb Binding energy |
Total energy |
Dipole moment |
|
HL |
172.11487 |
-4.213.2911 |
-98871.01680 |
10.561 |
|
V-complex |
-21.21375 |
-8.8527412 |
-7878.79461 |
48.970 |
|
Cr-complex |
-14.84315 |
-10.979864 |
-9519.75314 |
9.847 |
Optimized vibrational spectra for ligand
The vibrational spectra of the free ligand and their metal complexes were calculated (Table 8). The theoretically calculated wavenumbers for this ligand showed that some deviations from the experimental values were generally acceptable in theoretical calculations [26]. The most diagnostic calculated vibrational frequencies were chosen for the assignment of ligand (HL) and metal complexes, and their respective experimental vibrational modes as shown in Table 8. The results obtained for the theoretical calculations of the frequencies agreed well with those of the experimental values.
Optimized geometries of LH and their complexes
All theoretically probable structures of free ligand and their complexes were calculated by PM3 method in gas phase to search for the most probable model aiming at building the stable structure.
Table 8: Comparison between the experimental and theoretical vibrational frequencies (cm-1) for free ligand metal complexes
|
Ligand HL |
ν (OH) |
ν (NH2) |
ν (NH) |
(C-H) aliphatic |
(C-H) Aromatic |
ν (SO2) |
ν (N=N) |
|
Found |
3492 |
3377 3318 1618 |
3142 |
2927 |
3042 |
1035 1091 |
1467 1406 |
|
Calc. |
3500 |
3401 3280 1706 |
3200 |
3010 |
3117 |
1121 997 |
1490 1469 |
|
mistake % |
0.002 |
0.007 -0.011 0.051 |
0.018 |
0.027 |
0.024 |
0.076 -0.094 |
0.015 0.042 |
Conclusion
In this research we prepared new azo ligand 4-amino- N- (5- methyl- isaxazol- 3- yl)- benzenesulfonamide, by reacting the diazonium salt of sulfamethoxazole with coupling compound 3-amino phenol. Spectroscopic techniques (UV-Vis, FTIR, 1H and 13C-NMR, and LC-Mass) as well as micro elemental analyses (C.H.N.O) and TGA and SDC were used to identify the azo ligand. Complexes of (Zn(II), Cr(III), Cu(II) and VO(II)) were produced and characterized by atomic absorption, elemental microanalysis, infrared, LC-Mass, TGA, DSC and UV-Vis spectral techniques, as well as conductivity and magnetic quantifications. The resultant complexes were gave the following geometries; tetrahedral for each of Cu and Zn complexes, square pyramidal for VO complex and octahedral for Cr complex. The ligand and some of its complexes and their corresponding metal salts were biologically investigated toward bacteria and fungi in various concentrations and noticed that, their activity decreases at lower concentrations.
Acknowledgments
Department of Chemistry, College of Science for Women, University of Baghdad and Prof. Dr. Abbas Ali Salih Al-Hamdani.
Funding
This research did not receive any specific grant from fundig agencies in the public, commercial, or not-for-profit sectors.
Authors' contributions
All authors contributed toward data analysis, drafting and revising the paper and agreed to responsible for all the aspects of this work.
Conflict of Interest
We have no conflicts of interest to disclose.
ORCID:
Shaima Mohammed Reda
https://www.orcid.org/0000-0002-9700-7211
Abbas Al-Hamdani
https://orcid.org/0000-0002-2506-986X
HOW TO CITE THIS ARTICLE
Shaima Mohammed Reda, Abbas Ali Salih Al-Hamdani. Synthesis, Characterization, Thermal Analysis and Bioactivity of Some Transition Metals Complexes with New Azo Ligand. Chem. Methodol., 2022, 6(6) 475-493
https://doi.org/10.22034/CHEMM.2022.335815.1468
URL: http://www.chemmethod.com/article_148572.html
- Shankarling G.S., Deshmukh P.P., Joglekar A.R., Environ. Chem. Eng., 2017, 5:3302 [Crossref], [Google Scholar], [Publisher]
- Gürses A., Açıkyıldız M., Güneş K., Gürses M.S., Dyes Pigm., 2016, 31–45 [Crossref], [Google Scholar], [Publisher]
- Shah M., J. Environ. Bioremediat. Biodegrad., 2014, 2:231 [Google Scholar], [Publisher]
- Al-Hamdani A.A.S., Ahmed S.D., Shake S.H., Hassan Z.A., Baghdad Sci. J., 2016, 13 [Google Scholar]
- Al-Hamdani A.A.S., Shaalan N., Hassan S.S., Hasan Z.A., Baghdad Sci. J., 2016, 13 [Google Scholar]
- Al-Hamdani A.A.S., Balkhi A., Falah A., Shaker S.A., Chi. Chem. Soc., 2015, 60:2774 [Crossref], [Google Scholar], [Publisher]
- Al Zoubi W., Al‐Hamdani A.A.S., Putu Widiantara I., Hamoodah R.G., Ko Y.G., Phys. Org. Chem., 2017, 30:e3707 [Crossref], [Google Scholar], [Publisher]
- Al-Hamdani A.A.S., Hamoodah R.G., Baghdad Sci. J., 2016, 13:770 [Google Scholar], [Publisher]
- Benkhaya S., Achiou B., Ouammou M., Bennazha J., Younssi S.A., M’rabet S., El Harfi A., Today Commun., 2019, 19:212 [Crossref], [Google Scholar], [Publisher]
- Al Zoubia W., Al-Hamdani A.A.S., Mosab K., Organomet. Chem., 2016, 30:810 [Crossref], [Google Scholar], [Publisher]
- Al-Hamdani A.A.S., Abdel M.B., Falah A., Shayma A.S., Saudi Chem. Soc., 2016, 20:487 [Crossref], [Google Scholar], [Publisher]
- Saeed A.M., AlNeyadi S.S., Abdou I.M., Comm., 2020, 26:192 [Crossref], [Google Scholar], [Publisher]
- Al Zoubi W., Al-Hamdani A.A.S., Ko Y.G., Sci. Technol., 2017, 52:1052 [Crossref], [Google Scholar], [Publisher]
- Kuate M., Conde M.A., Nchimi K.N., Paboudam A.G., Ntum S.J.E., Ndifon P.T., J. Org. Chem., 2018, 8:298 [Crossref], [Google Scholar], [Publisher]
- Al Zoubi W., Al‐Hamdani A.A., Ahmed S.D., Ko Y.G., Organomet. Chem., 2018, 32:e3895 [Crossref], [Google Scholar], [Publisher]
- Obaid S.M.H., Jarad A.J., Al-Hamdani A.A., Phys.: Conf. Ser., 2020, 1660:012028 [Publisher]
- Suleman V.T., Al-Hamdani A.A.S., Ahmed S.D., Jirjees V.Y., Khan M.E., Dib A., Al Zoubi W., Ko Y.G., Organomet. Chem., 2020, 34:e5546 [Crossref], [Google Scholar], [Publisher]
- Al-Hamdani A.A.S., Al Zoubi W., Acta A Mol. Biomol. Spectrosc., 2015, 137:75 [Crossref], [Google Scholar], [Publisher]
- Al Zoubi W., Al‐Hamdani A.A.S., Susan D.A., Hassan M.B., Al‐Luhaibi R.S.A., Adnan D., Young G.K., Phys. Org Chem., 2018, 32:e3916 [Crossref], [Google Scholar], [Publisher]
- Ye Z., De Boni L., Neves U.M., Mendonça C.R., Bu X.R., Tetrahedron Lett., 2009, 50:1371 [Crossref], [Google Scholar], [Publisher]
- Kareem M.J., Al-Hamdani A.A.S., Ko Y.G., Al Zoubi W., Mohammed S.G., Mol. Struct., 2021, 1231:129669 [Crossref], [Google Scholar], [Publisher]
- Obaid S.M.H., Sultan J.S., Al-Hamdani A.A.S., J. Chem., 2020, 20:1311 [Crossref], [Google Scholar], [Publisher]
- Al-Hamdani A.A.S., Al-Khafaji N.R., Shaalan N., J. Pharm. Biol. Chem. Sci., 2017, 8:740 [Crossref], [Google Scholar], [Publisher]
- Al-Hamdani A.A.S., Al-dulyme N.K.G., Ibn AL-Haitham J. Pure Appl. Sci., 2017, 30:69 [Google Scholar], [Publisher]
- Al Zoubi W., Mohamed S.G., Al-Hamdani A.A.S., Mahendradhany A.P., Ko Y.G., RSC Adv., 2018, 8:23294 [Crossref], [Google Scholar], [Publisher]
- Al-Hamdani A.A.S., Hasan Z.A.A., Baghdad Sci. J., 2016, 13:511 [Google Scholar], [Publisher]
- Jirjees V.Y., Suleman V.T., Al-Hamdani A.A.S., Ahmed S.D., Asian J. Chem., 2019, 31:2430 [Crossref], [Google Scholar], [Publisher]
- Al Zoubi W., Al-Hamdani A.A.S., Sunghun B., Ko Y.G., Inorg. Chem., 2021, 41:213 [Crossref], [Google Scholar], [Publisher]
- Al Zoubi W., Kim M.J., Al‐Hamdani A.A.S., Kim Y.G., Ko Y.G., Organomet. Chem., 2019, 33:e5210 [Crossref], [Google Scholar], [Publisher]
- Jirjees V.Y., Al‐Hamdani A.A.S., Wannas N.M., Faeqad A.R., Dib A., Al Zoubi W., Phys. Org. Chem., 2021, 34:e4169 [Crossref], [Google Scholar], [Publisher]
- Bal S., Bal S.S., Chem., 2014; 2014:1 [Crossref], [Google Scholar], [Publisher]
- Samy M.E., Moamen S.R., Fawziah A.A., Reham Z.H., J. Environ. Res. Public Health., 2021, 18:8030 [Crossref], [Google Scholar], [Publisher]
- Kirill V.Y., Aleksandr S.S., Werner K., Sergey A.G., Molecules, 2020, 25:768 [Crossref], [Google Scholar], [Publisher]
- Kareem M.J., Al-Hamdani A.A.S., Jirjees V.Y., Khan M.E., Allaf A.W., Al Zoubi W., Phys. Org. Chem., 2020, 34:e4156 [Crossref], [Google Scholar], [Publisher]
- Jirjees V.Y., Al‐Hamdani A.A., Wannas N.M., A. R F, Dib A., Al Zoubi W., Phys. Org. Chem., 2021, 34:e4169 [Crossref], [Google Scholar], [Publisher]
- Jirjees V.Y., Suleman V.T., Al-Hamdani A.A., Ahmed S.D., Asian J. Chem., 2019, 31:2430 [Google Scholar]
)