Document Type : Original Article
Authors
Department of Chemistry, College of Science, University of Baghdad, Baghdad, Iraq
Abstract
In this study, reversed flow injection analysis (rFIA) spectrophotometric method was used for determination of Tenoxicam (TNX) in pure and pharmaceutical forms. This method was based on the charge transfer interaction of TNX with 0.005 M of Metol reagent (MFS) in the presence of 0.02 M of potassium persulfate as oxidant agent. Color product was formed give absorbance measured at λmax=530 nm with ratio 2:1. All optimum physical and chemical conditions were studied. Linearity of TNX was observed at the range of 2-140 µg.mL-1 and the detection limit was 1.393. However, quantitation limit was 4.643 µg.mL-1. The method offered correlation coefficient, (r:0.9997) in rFIA applied for TNX pharmaceutical tablets give good values, by the comparison between rFIA results and UV results, using the standard addition method taken 20 µg/ml amount for one concentration of Tenoxicam give accurate quantitation of drug, the rFIA, the best analysis and the suggested method could be utilized for pharmaceutical analysis.
Graphical Abstract
)
Keywords
Main Subjects
Introduction
The reagent (4-methylamino)- phenolsulfate is known as metol or Pictol. The Synonym was (MFS). Molecular Formula (C7 H9 NO)2.H2 SO4 in Figure 1, molecular mass was 344.38 g/mole. It is an organic compound contains amine (–NH2) and hydroxyl groups (–OH). It is an excellent developing agent for most continuous tone developer applications [1]. Spectrum chemical manufactured reagent grade products meet the toughest regulatory standards for quality and purity keeping tightly closed in light-resistant containers [2]. Various analytical techniques determined in MSF including spectrophotometry [3, 4], electrochemical analysis [5], clinical analysis [6, 7], High performance liquid chromatography [8], and flow injection analysis [9, 10]. Based on these methods is higher cost, complicated process, difficult to handle, and time variation.

Figure 1: Chemical structure of metol reagent
Tenoxicam, meloxicam, and piroxicam are oxicam group drugs, which are enolic acid derivatives with similar structural properties [11]. Tenoxicam (TNX) drug identification is demonstrated in Figure 2, and it chemical name is 4-hydroxy-2-methyl-N-(pyridin-2-yl)-2H-thieno[2,3-e][1,2] thiazine-3-carboxamide 1,1-dioxide, its molecular formula: C13H11N3O4S2, molecular weight: 337.4 g/mole, solved in distilled water and organic solvent like ethanol. Tenoxicam works by blocking the chemicals effect and cause pain and inflammation by blocking the effect of COX enzymes [12, 13], Tenoxicam was determined by many method such as high performance liquid chromatography [14], the UV spectrophotometer [15-17], Electro analytical method [18], Volta metric analysis [19], Fluorescence spectrophotometer [20], Flow Injection Spectrophotometric [21], X- ray [22], Ion-pair spectrophotometry [23], and transmission electron microscopy (TEM) , scanning electron microscopy (SEM), X-ray diffraction (PXRD), dynamic light scattering (DLS), and Fourier-transform infrared spectroscopy (FTIR) [24], photo catalysis [25], and a colloidal gold immunochromatographic strip [26].

Figure 2: Chemical structure of Tenoxicam
The mechanism of new charge transfer interaction between TNx and MFS reagent in the presence of potassium persulfate agent for preparation of color product could be explained in results and discussion paragraph, so this interaction done by using spectrophotometric-reverse flow, as the aim of the work.
Materials and Methods
Preparation of metol reagent
(p-Methyl aminophenol sulfate) solution (0.005 M). The stock solution was prepared by mixing 0.8612 g of MFS reagent with M.Wt:172.19 mol-1 in 10 mL ethanol with 90 mL distilled water and volume was completed to mark in volumetric flask.
Preparation of tenoxicam
TNX stock pure standard: with purity >99% was obtained from Middle East Pharmaceutical Industry Co. Ltd. Baghdad, Iraq, (200 μg.mL-1) was organized by dissolving 0.02 g of TNX in 10 mL of ethanol and volume was completed with distilled water in 100 mL volumetric flask.
Pharmaceutical tablets
The TNX tablet was bought from the pharmacy in Baghdad, Iraq, and the drug form is (Tilcotil:Tenoxicam 20 mg, 10 film-coated tablets, Switzerland) and (profinal:Taken 0.02 g known weight dissolved in 10 mL ethanol solvent with 90 ml distilled water in 100 mL volumetric flask for pure standard, and then filtered to remove additives and diluted in volumetric flask 25 mL with filtered liquid.
Potassium persulfate oxidant solution
To prepare (0.02 M) as solution should weight 0.54 g and dissolve in 100 mL distilled water, and then solution should be put in volumetric flask size 100 mL volume.
UV-Vis spectrophotometer
Shimadzu UV mini -1240 digital single beam has been used for absorbance and spectral measurements containing movement cell of 50 μl internal volume with 1 cm path length used to measure spectral and absorbance.
General procedures of rFIA
Two channel manifolds were used for the spectrophotometric determination of TNX. A series of TNX working solution was used in a range of concentrations 2 to 140 to method. In this method, about 150 μl of (MFS) reagent, (0.005 M) is injected in the carrier stream of a TNX drug, and then the mixture was combined with 0.02 M of Potassium persulfate agent at 20 ml/min flow rate, and mixed in the reaction coil of 50 cm. Moreover, the absorbance of the reddish product is measured at 530 nm.
Results and Discussion
Absorption spectra
The work includes many steps: In experimental conditions, the stock solution of the standard pure Tenoxicum was prepared by dissolving the concentration 200 ppm in distilled water by dilute law obtained 50 ppm from it and it was put in 25 mL volumetric flask. (4-methylamino)- phenol sulfate (MFS) reagent 0.005 M as well as oxidant agent Potassium persulfate were prepared with 0.02 M. The addition was tested with different volumes of prepared solutions to obtained the product, the effect was tested by applying 2 mL of reagent in 10 mL size volumetric flask and 1 mL of oxidant agent was added, and then this mix was added to volumetric flask (10 mL size) containing 3 mL of TNX pure standard substances. The color product will form and measure at UV-Vis spectrophotometer to obtained the maximum wave length at 530 nm in Figure 3 show the interaction result. If the energy absorbed by the solution for some wavelengths of the visible region is large, and then the transmitted ray or solution is colored, and the apparent color of the solution is always the complement of absorbed light.

Figure 3: (a) Solution of blank and (b) color product for complex
Quantitative determination of the concentration of a component in an unknown solution by measuring the absorbance of colored solution, estimating which colored solution of any substance in a clear liquid should absorb light that returns to the visible region.
Optimization of interaction conditions
The reverse flow injection manifold was tested for interaction work. For TNX determination with high intensity colored product, good reproducibility, and low dispersion, it would be better to start with experimental parameters to perform the reaction between TNX, MFS, and Potassium persulfate agent through rFIA method. The TNX concentration in all sequential experiments fixed on (50 µg.mL-1) and the chemical and physical conditions, as listed in Table 1.
Order of mixing
Two different rFIA manifolds were used which included two different paths of proposed reaction to estimate TNX A, and B, as depicted in Figure 4 The rFIA manifold contained two channels for K2S2O8 and TNX flowing solutions, while MSF reagent was injected through injection valve. After adopted all the conditions, it was found that (B) path gave the maximum absorbance comparing to the others. The K2S2O8 solution line was flowed as carrier to the injected volume of MFS, and then merged with TNX stream solution from the second line and the solutions passed through the reaction coil. Finally, the formed colored compound was measured. The rFIA manifold B was established to study the chemical and physical parameters to acquire the optimum conditions.
Table 1: Preliminary conditions


Figure 4: rFIA manifolds suggested for determination of TNX (A and B) the maximum absorbance was shown in a manifold. B manifold give high absorbance chosen for complete work
Effect of chemicals and physical variables
Effect of MFS concentration
Series of MFS concentrations ranging from (0.001 to 0.01) M was studied. The results declared that absorbance and sensitivity increased with increasing MFS concentration reaching 0.005 M, absorbance varies with wavelength and solvent, and also changes with concentration. Therefore, it was chosen as an optimum concentration, as displayed in Figure 5.
Effect of the best oxidant agent for work
In this study, the effect of oxidant agent, a range of sequent types agents were prepared among (K3[Fe(CN)6], FeCl3, NaIO4, K2S2O8, and [(NH4)2Ce(NO3)6]. The K2S2O8 agent revealed the maximum absorbance. However, the others types increasing the absorbance was observed. Therefore, K2S2O8 agent was adopted as the optimum agent for work Figure 6.
Effect of K2S2O8 concentration
To study the effect of K2S2O8 concentration, a range of sequent concentrations were prepared from 0.005 to 0.03 M. The concentration 0.02 M revealed the maximum absorbance, and then a gradually decreased with increasing the concentration was observed. Therefore, 0.02 M was adopted as the optimum concentration for K2S2O8, as shown in Figure 7.

Figure 5: Effect of MFS reagent concentration on TNX determination

Figure 6: Types of agents chosen for study

Figure 7: Effect of K2S2O8 concentration through the method of TNX estimation
Effect of flow rate
The flow rate of solutions plays an essential role in rFIA technique particularly on the dispersion. The effect of flow rate was studied starting from 0.25 to 3.5 mL.min-1. The highest sensitivity and the maximum absorbance revealed in the flow rate of 2.5 mL.min-1 which supposed to be suitable for reaction complete between the reagent and TNX drug while increasing more than 2.5 mL.min-1, led to dropping in absorbance, because of more diluting and insufficient mixing between the reactants, as seen in Figure 8.
Effect of reaction coil length
The effect of reaction coil length was studied by selecting various reaction coil lengths between 25 and 250 cm to establish the best reaction coil that produced the maximum absorbance. It was found that 50 cm coil length provides the highest absorbance whereas increasing coil length means spending more time in the coil and may increase the dispersion of reactant zone moreover boost analysis time. Hence, 50 cm was selected as the optimum reaction coil, as illustrated in Figure 9.
Effect of injected volume
A sufficient volume of MFS reagent could be necessary to allow effective reaction, produce good sensitivity and high accuracy. The absorbance was examined by injecting MFS solution with volumes ranging from 60 to 200 μL. It was indicated that 150 μL injected volume appeared the maximum absorbance. Therefore, it was selected for further experiences. Increasing reagent volume effected on the dispersion and may cause no intermixing between the reactants streams and decreased in sensitivity and sampling rate, as depicted in Figure 10.

Figure 8: Effect of different flow rate used to determine TNX

Figure 9: The effect of various reaction coil lengths were employed in TNX determination

Figure 10: The effect of injected volume of MFS through determination of TNX
Mechanism of the reaction
The proposed mechanism is based on the charge transfer interaction between MFS and TNX in the presence of oxidizing agent K2S2O8. Potassium persulfate agent oxidizes MFS losing electrons intermediate which is assumed to be the active species. The intermediate compounds with the most of TNX to result colored product, as shown in Figure 11. The structure of color product gives 2:1 ratio for complex.
Calibration graph
The calibration graph for TNX determination was accomplished by preparing a set of solutions to cover a range from (2 to 140 μg.mL-1). The concentrations were prepared from stock solution of TNX (200 μg.mL-1). The optimum parameters were adopted and each concentration repeated triplicate. The calibration graph was indicated in Figure 12, all analytical characters and the statistical treatments summarizes the analytical data for the calibration graphs [27, 28], which demonstrate the high precision and the best sensitivity for the r FIA method.
Accuracy and precision
Table 3 lists the values of Accuracy (E%), recovery (Rec%), and precision (RSD) were estimated for the method of TNX determination. Three different concentrations of TNX (20, 50, and 70) μg.mL-1 were prepared and the measurement for each concentration repeated five times. It was indicated that this method demonstrated good relative standard deviation (RSD%).

Figure 11: Proposed charge transfer interaction mechanism between TNX and MFS

Figure 12: Calibration graph of TNX
Table 2: Values results of the rFIA applied for TNX determination

Table 3: The accuracy and precision of TNX determination using rFIA

Pharmaceutical applications
The TNX estimation in pharmaceutical dosage was performed using method which is an effective and commonly method used to overcome matrix interferences or additives, this can be done by adding known quantities of the standard TNX to each solutions of three different concentrations (20, 50, and 70) μg.mL-1 from TNX tablets and measuring the absorbance. High accuracy and precision was detected provides in Table 4.
Standard addition method (SAM) has been being used for instrumental analysis; SAM is a very old, intelligent idea to analyze a compound as accurately as possible. The SAM is a good choice for accurate quantifications of target compounds [29].
Figure 13 demonstrates taken 20 µg/mL amount for one concentration of standard addition calibration curve to obtain an accurate concentration of a target compound.
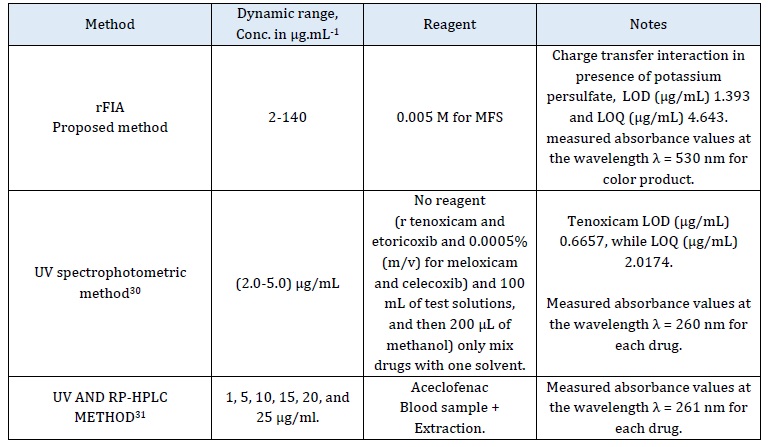
Comparison between the proposed method used for tenoxicam determination and other methods for the drug determination (Table 5).
Table 4: Accuracy and precision for determination of TNX in capsules

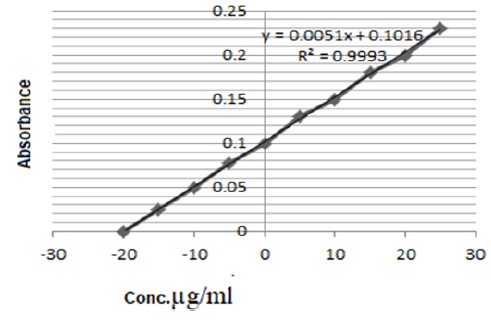
Figure 13: Standard addition method used one concentration used 20 µg/ml for determined TNX in tablets by rFIA Analysis
Table 5: Comparison between proposed method rFIA analysis and other method for determination TNX
Conclusion
The proposed method Spectrophotometric-Reverse Flow injection Analysis was found to be simple and rapid for the TNX determination from pure and pharmaceutical formulations. In this research, results have been presented for interaction behavior of TNX with MFS reagent in presences of K2S2O8 manifold injection and moving solutions. Results demonstrated that color product give the maximum wave length at 530 nm after charge transfer interaction. In addition, calibration curve shows leaner relationship between absorbance and concentrations of TNX. Analyzing effective parameters influencing reverse flow gives good and satisfied results obtained from work and statically calculations.
Disclosure Statement
No potential conflict of interest was reported by the authors.
Funding
This research did not receive any specific grant from funding agencies in the public, commercial, or not-for-profit sectors.
Authors' Contributions
All authors contributed to data analysis, drafting, and revising of the paper and agreed to be responsible for all the aspects of this work.
Orcid
Allaa Hussein Mhdi
https://orcid.org/0000-0001-9108-8076
Sadeem Subhi Abed
https://orcid.org/0000-0001-9606-1972
HOW TO CITE THIS ARTICLE
Allaa Hussein Mhdi*, Sadeem Subhi Abed. Spectrophotometric -Reverse Flow Injection Method for the Determination of Tenoxicam in Pharmaceutical Tablets. Chem. Methodol., 2023, 7(6) 435-446
)